
Nội dung
In this article, AZDIGI will show you how to install and integrate Netdata into a server using Centos Web Panel quickly with just a few mouse clicks. Please follow along with the article.
I. Overview
What is Netdata?
Netdata Netdata is an open-source solution from the Firehol organization designed to work on Linux systems. It provides the main function of real-time monitoring of the resources and applications running on the Linux system. You can learn more at Netdata’s homepage: https://www.netdata.cloud/.
Advantages
- The bootstrap dashboard is very eye-catching.
- You can manually adjust the dashboard according to your liking.
- Fast and stable speed, written in C language, takes up little RAM.
- No dependency on library support sources.
- The monitor can be expanded to add more resources as needed.
The parts that Netdata will participate in monitoring
- Total and Per Core CPU usage, interrupts, softirqs and frequency.
- Total Memory, RAM, Swap and Kernel usage.
- Disk I/O (per disk: bandwidth, operations, backlog, utilization, etc).
- Monitors Network interfaces including: bandwidth, packets, errors, drops, etc).
- Monitors Netfilter / iptables Linux firewall connections, events, errors, etc.
- Processes (running, blocked, forks, active, etc).
- System Applications with the process tree (CPU, memory, swap, disk reads/writes, threads, etc).
- Apache and Nginx Status monitoring with mod_status.
- MySQL database monitoring: queries, updates, locks, issues, threads, etc.
- Postfix email server message queue.
- Squid proxy server bandwidth and requests monitoring.
- Hardware sensors (temperature, voltage, fans, power, humidity, etc).
- SNMP devices.
In this article, AZDIGI will show you how to integrate Netdata into Centos Web Panel (CWP), as well as a preliminary guide so you can use it to monitor resource parameters on your VPS/Server in real-time as well as in previous times.
II. Implementation Guide
To install and integrate Netdata into Centos Web Panel, follow these 2 steps:
Step 1: Install Netdata on Centos Web Panel
To quickly install Netdata, you can access the CWP admin page through the following link: https://45.252.249.104:2087/ and use the VPS’s root information to login =>
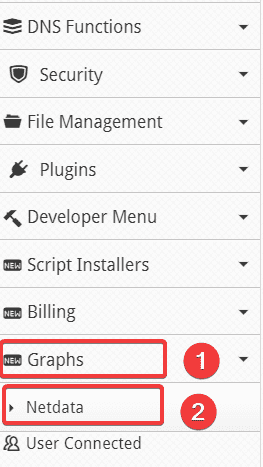
Graphs => Netdata
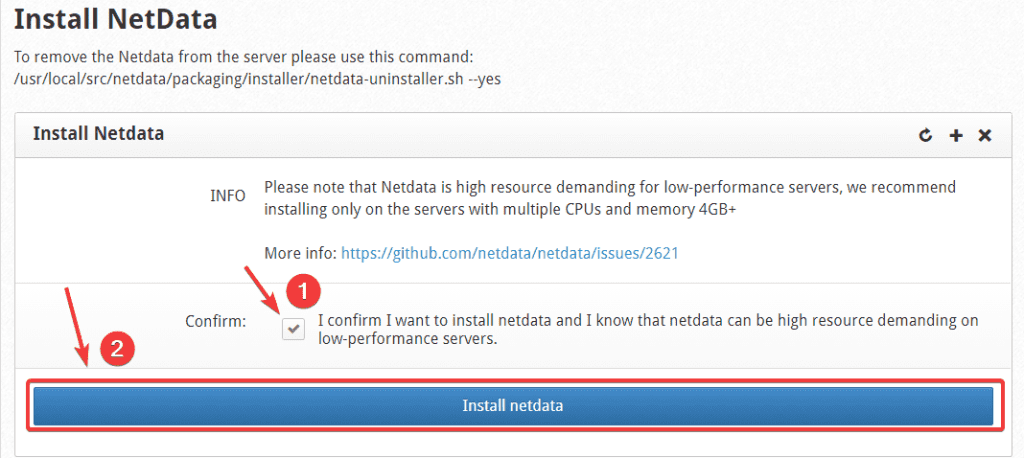
At the next interface, you tick the Confirm box to confirm the installation => click Install netdata to start the installation.
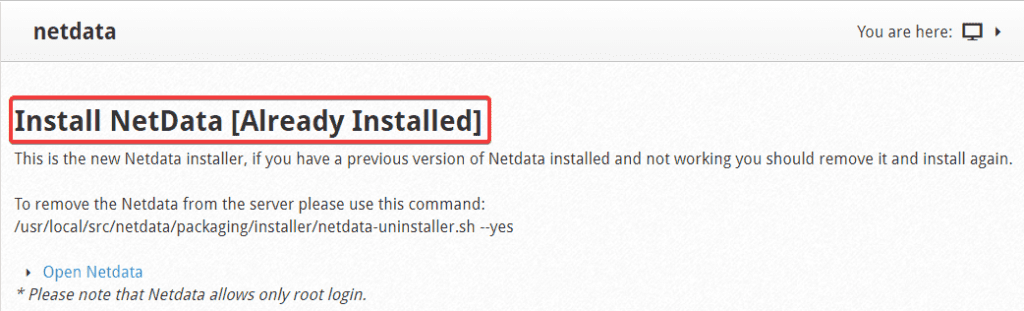
Depending on each VPS, the installation process will take about 5-10 minutes. If you receive the message below, you have successfully installed it.
Step 2: Use Netdata on Centos Web Panel
To use Netdata, you have 2 methods to access as follows:
Method 1: Access from CWP admin interface with Root privileges
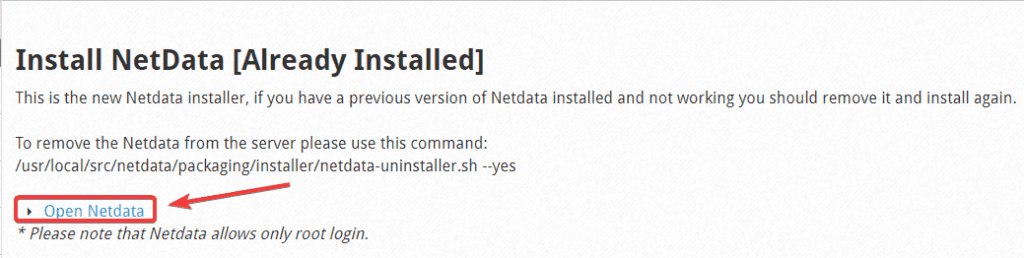
Go to Graphs => Netdata => Open Netdata (click to redirect directly to Netdata).
Method 2: Access through the link
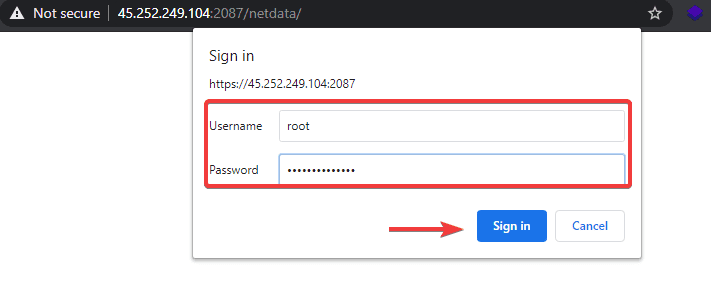
You can access Netdata through the link https://45.252.249.104:2087/netdata/ (remember to replace the IP with your server’s IP) and use the Root VPS information to log in.
After successfully accessing Netdata, the interface of Netdata will be displayed as below:
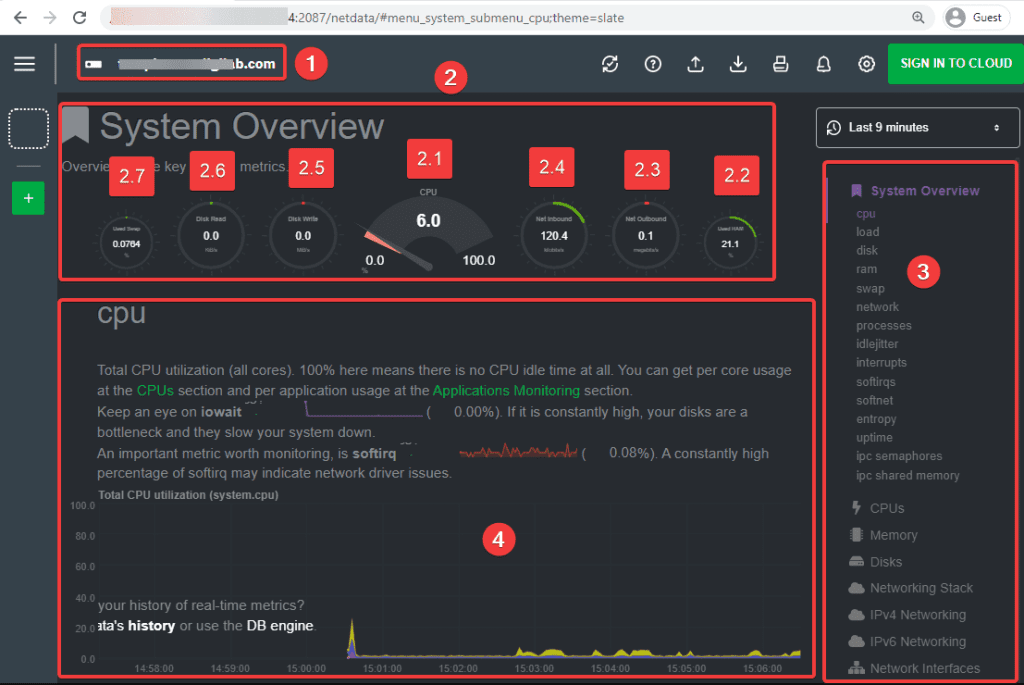
I will explain the Netdata interface:
- 1: Your VPS/server hostname name.
- 2: The main system parameter table on your VPS/server:
- 2.1: Current CPU usage. From 0.0 to 100.0 is the maximum.
- 2.2: Current RAM usage. Unit
- 2.3: Current outgoing network traffic.
- 2.4: Current inbound network traffic.
- 2.5: Data write speed to current storage hardware.
- 2.6: Data read speed to current storage hardware.
- 2.7: Amount of virtual RAM (SWAP) currently in use.
- 3: Go into the details of the parameters.
- 4: Detailed parameters.
You can use your mouse or hand (on touch screens like iPad, smartphone…) to pull back many previous timelines, this will make it extremely convenient to track the history of system resources.
If you pay attention, you will see a bell 🔔 in the upper right corner. If something is wrong with your system, this bell 🔔 will have a tick next to it and you should click to see the warning. As below, there is a warning at (1).
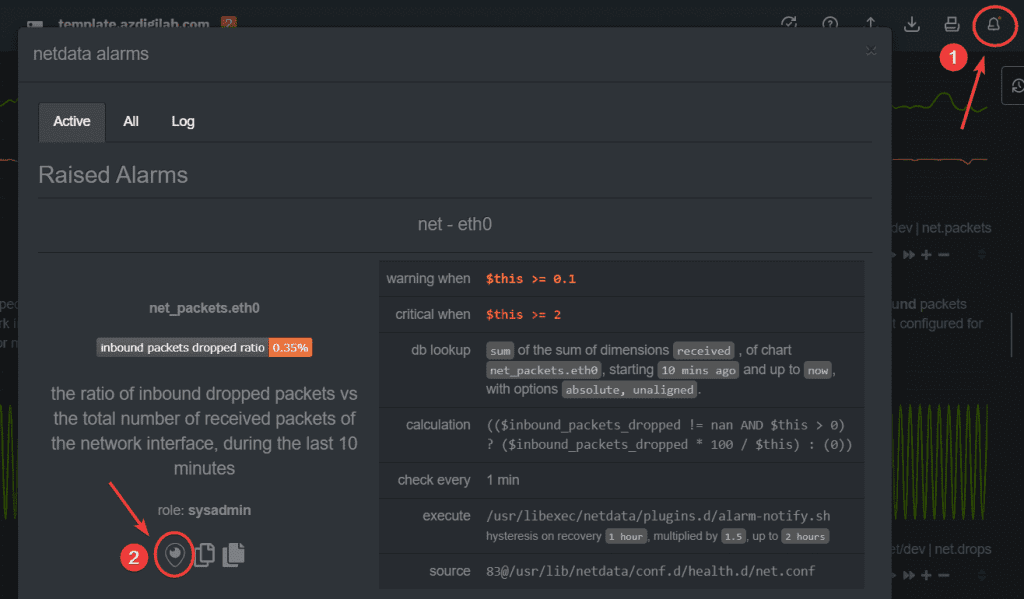
After clicking on the alert, you will get a small window listing all the current alerts. Here, I only have one warning about dropped packets. You can click the locator icon in (2) to quickly move to the chart receiving the current alert, as shown below:
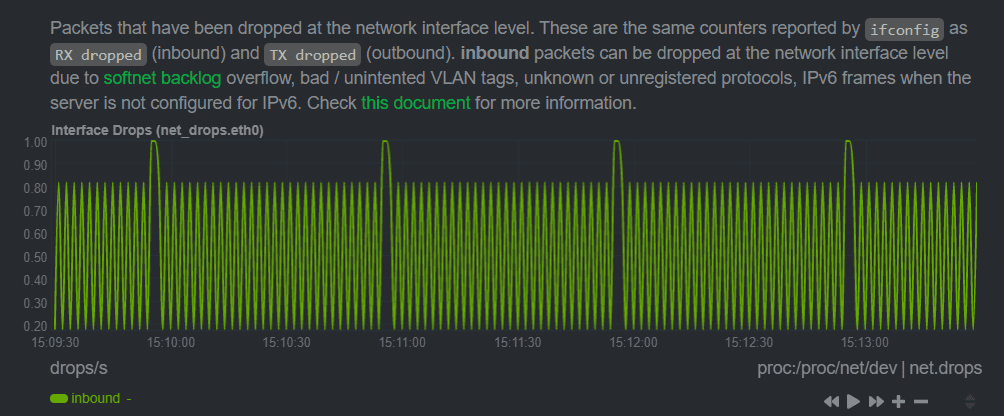
You will see details of how the problem occurred at what time and much more information.
III. Summary
Thus, AZDIGI has shown you how to quickly and easily install and integrate Netdata into a server using Centos Web Panel. With Netdata, you can be more assured that the resource information on your VPS is always updated and alerted in the most detailed and accurate way. From there, you can give some timely solutions to be able to handle if something goes wrong.
Wishing you success! If you find the article helpful, please share it widely.
You can refer to other articles about CWP at the link below:
If you need assistance, you can contact support in the ways below:
- Hotline 247: 028 888 24768 (Ext 0)
- Ticket/Email: You use the email to register for the service and send it directly to: support@azdigi.com
