The top command in Linux is used to display all the processes running in the Linux environment. This tutorial will show you how to use the top command by explaining the different parameters available and what they display.
What is the Top command in Linux?
In Linux, there is a command you will most often use to monitor the status of server information, which is top. This command will help you to see an overview of the server, such as the percentage of CPU used, the overload through the load average parameter, the number of active processes and much other useful information.
How to use the top command
Basically, all you need to do to display the currently running processes is to type in the terminal the following:
top
Important information of the top command
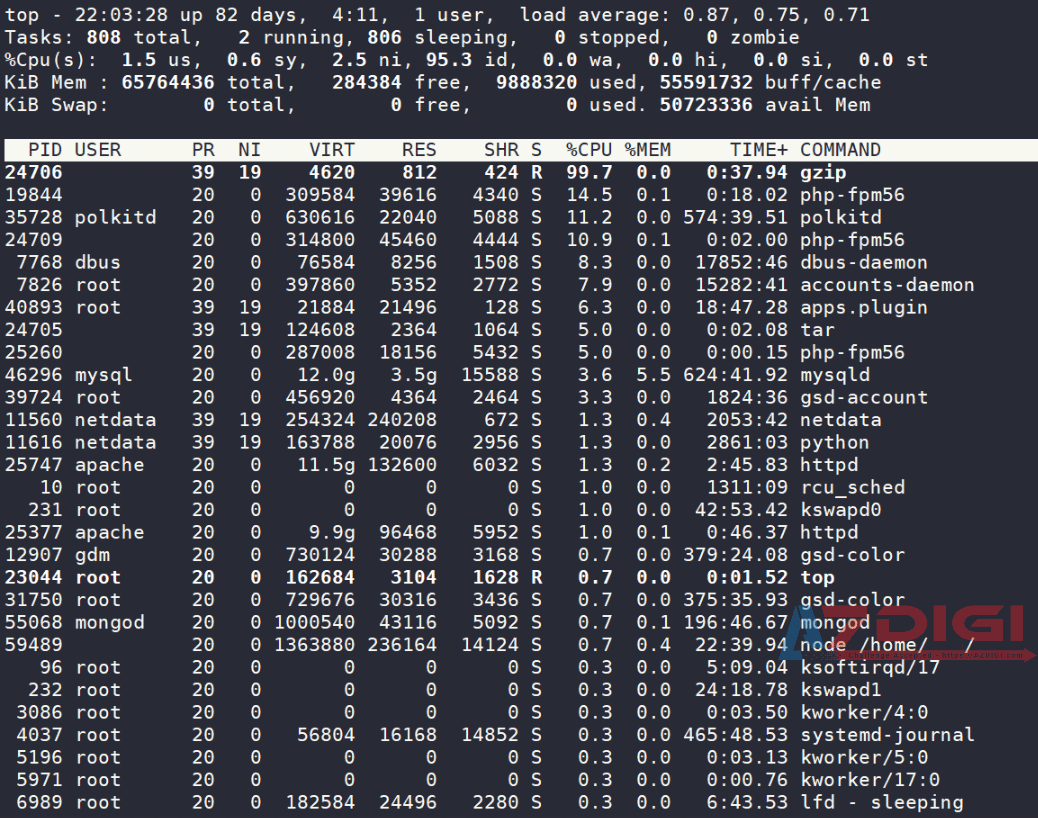
A lot of information will be displayed when you use the top command, I will explain all this information in an easy-to-understand and simple way.

The following information is displayed when you run the top command in Linux:
Line 1
- Current system time
- Uptime
- Number of users
- Load average
- The load average shows the system load time for the last 1 minute, 5 minutes and the last 15 minutes.
The load average for each system will be different. If your Server/VPS has 2 CPU(s), the load average should be less than 2. Similarly, if Server/VPS has 40 CPU(s), the load average should be less than 40. If this number is higher than the number of your CPU, the system is overloaded, the amount of processing work exceeds what the current CPU can handle.
Line 2

- Total number of tasks available on the server
- Number of running tasks
- Number of tasks in the “sleeping” state
- Number of stopped tasks
- Number of zombie tasks (progress does not exist or is broken)
Line 3

- CPU usage by users as a percentage
- CPU usage by system as a percentage
- CPU usage by low priority processes as a percentage
- CPU usage by idle process (process indicates the processor is idle) in percentage
- CPU usage by io wait (time spent in idle CPU waiting for disk I/O to complete) as a percentage
- CPU usage by hardware interrupt in percentage
- CPU usage by a software interrupt in percentage
- CPU usage by steal time (the time the virtual CPU “waits” for the real CPU, while the hypervisor is serving another virtual processor) as a percentage
Line 4

- Total system memory (in KiB units)
- Free memory
- Used memory
- Buffer cache
Line 5

- Total available swap (in KiB)
- Total swap available
- Total swap used
- Available memory
Swap is virtual RAM used when physical memory (RAM) is full. Always enable Swap so that when the system is full of physical RAM, it will not hang.
Currently, I am turning off Swap (not recommended), to re-enable swap you use the command:
swapon -a
In some cases, your swap used parameter will increase when the RAM is full, and when the RAM is no longer full, the amount of swap will not decrease. To reduce the swap used to 0, you use the following 2 commands:
swapoff -a
swapon -a
You wait for the swapoff -a command to finish running and then run the swapon -a command, the time is long or short, depending on how much swap you have used. During this process, the swap used will increase to 100%.
I turned off swap because I finished using the command swapoff -a but forgot to run swapon -a , please don’t be like me.
Main board

- Process ID
- Users (I have hidden some users, but the default is not empty)
- Priority level
- Nice level (calls a shell script with a specific priority)
- Virtual memory used by the process
- The “resident” memory that a process uses (i.e. the process is always in memory and cannot be moved to another storage device)
- Shareable memory
- CPU used by the process as a percentage of 1 CPU.
- Memory used by the process as a percentage
- The time the process was run
- Command
Keep the top command running in the background on Linux computers
You can easily keep the top command running without having to enter the command into the Terminal every time you turn on your computer.
To pause the top command and resume using the terminal, press CTRL + Z on your keyboard.
To bring the top command back to the foreground, type fg.
The main parameters for the top command
| Parameter | Name | Describe |
-h | Help | Display the content of the Top command instruction |
-v | Version | View the version of the library in use |
-b | Batch Mode | Using the top command with batch mode allows sending the returned content of the command to another file or to another application |
-c | Toggle command line/program name | Progress displayed in the COMMAND column in the top command will be displayed as a command instead of a program name. Or switch back and forth while viewing the top command with the c key. |
-d | Delay time interval | Specify the refresh time of the top command interface. |
-e [k | m | g | t | p] | task memory scaling | Option to display the unit of memory in use, you can optionally display k(kibibytes), m(mebibytes), g(gibibytes), t(tebibytes), p(pebibytes), e(exbibytes). |
-u | Monitor user IDs mode | View command top with specified user processes |
-p | Monitor process IDs mode | View command top with the specified process ID |
-i | Idle process toggle | Don’t show idle processes |
Show current version
Enter the following to display the current version details for the top command:
top -h
The output will be as follows:
procps -ng version 3.3.10
Specify the time delay between screen refreshes
To specify the delay between screen refreshes while using top, you can enter the following command:
top -d
To refresh the screen every 5 seconds, you can enter:
top -d 5
Get a list of columns to sort by order
Get a list of columns where you can sort the top command by typing the following:
top -O
There are a lot of columns listed, so you can reduce the output as:
top -O | less
Sort columns in the top command by column name
Use the command in the previous section to find a sortable column, and then use the following syntax to sort by that column:
top -o
To sort by % CPU, type the following command:
top -o %CPU
Show only processes for a specific user
To show only processes that a specific user is running, use the following syntax:
top -u
For example, to show all the processes the user is running, you can run following command:
top -u gary
Hide Idle Task
The default view in the top command can be a bit messy, and if you only want to see active processes (i.e., those that are not idle), you can run the following command:
top -i
Add the column displayed with the top command:
While running the top command, you can press the F key to display the list of fields that can be displayed in the table:
- Use the arrow keys to move up and down the list of fields.
- To display a field on the screen, press the D key. To delete the field, press D on the field again. An asterisk (*) will appear next to the displayed fields.
- You can sort the table by field by pressing the S key on the field you want to sort.
- Press the Enter key to confirm the change and press Q to exit.
Switch between modes
While running the top command, you can press the A key to switch between the standard and alternate screens.
Change color
Press the Z key to change the color of the values in the top command.
There are three stages required to change color:
- Press S for summary data, M for notifications, H for column headers, or T for task information to target the area to change color.
- Select a color for the specified target: 0 is black, 1 is red, 2 is green, 3 is yellow, 4 is blue, 5 is magenta, 6 is cyan and 7 is white
- Press Enter to confirm the change
Press the B key to bold the text.
Change display in when the top command is running
While the top command is running, you can enable/disable many features by pressing the relevant keys.
The following table shows the key to press and the function it provides:
| Function keys | Describe |
| A | Alternate display (default off) |
| d | Refresh the screen after the specified delay, in seconds (default is 1.5 seconds) |
| p | PID monitoring (default off), display all processes |
| B | Bold enabled (default on), values are displayed in bold text |
| l | Show load average (default on) |
| t | Define how tasks are displayed (default 1 + 1) |
| m | Defines how memory usage is displayed (default 2 lines) |
| 1 | Single CPU (default off) – i.e., display for multiple CPUs |
| J | Align numbers to the right (default on) |
| j | Align text to the right (default off) |
| R | Reverse Sort (default on) – From highest processes to lowest processes |
| S | Cumulative time (default off) |
| u | User filter (default off), show only euid |
| U | User filter (default off), show any uid |
| V | Forest view (on by default), displayed as branches |
| x | Highlight column (default off) |
| z | Multicolor or monochrome display (default on) |
CThere are even more parameters for the top command. You can read more about them by typing the following in a terminal window:
man top
Thank you for following the article of AZDIGI!
About the author

Thạch Phạm
Đồng sáng lập và Giám đốc điều hành của AZDIGI. Có hơn 15 năm kinh nghiệm trong phổ biến kiến thức liên quan đến WordPress tại thachpham.com, phát triển website và phát triển hệ thống.