Integrating Netdata into Directadmin will help you get many early warnings of impending problems.
Since DirectAdmin version 1.61.0, Directadmin officially integrates Netdata into its service.
Netdata is an open-source tool to visualize and monitor real-time metrics, optimized to accumulate all types of data, such as CPU usage, disk activity, SQL queries, visits to the website, etc.
In this article, AZDIGI will show you how to integrate Netdata into DirectAdmin. As well as a rough guide for you to use to monitor resource parameters on your VPS/Server in real-time and in the past.
Step 1: Intergrate Netdata into Directadmin
First, you need SSH into your VPS/Server. If you don’t know how to SSH into your VPS/Server, you can refer to the following tutorial:
After you have SSH into your VPS/Server, you use the following two commands to integrate Netdata into DirectAdmin:
cd /usr/local/directadmin/custombuild
./build netdata
Explain the above two commands:
- cd /usr/local/directadmin/custombuild – Navigate to the custombuild directory to proceed with the build process.
- ./build netdata – Starts the integration of Netdata into DirectAdmin.
The installation process usually takes place quickly, with less than 5 minutes to complete. Below is a picture of my VPS after the installation is complete.

So the installation is complete, we continue with step 2 to learn basic usage.
Step 2: How to use it after integrating Netdata into DirectAdmin
To use Netdata, you need to log in to the account Admin at the DirectAdmin admin interface on the browser, usually http://IP_server:2222After you have logged in, go to Admin Tools > Netdata server metrics as below, you should open a new tab for Netdata server metrics to facilitate the parallel use of DirectAdmin and Netdata.
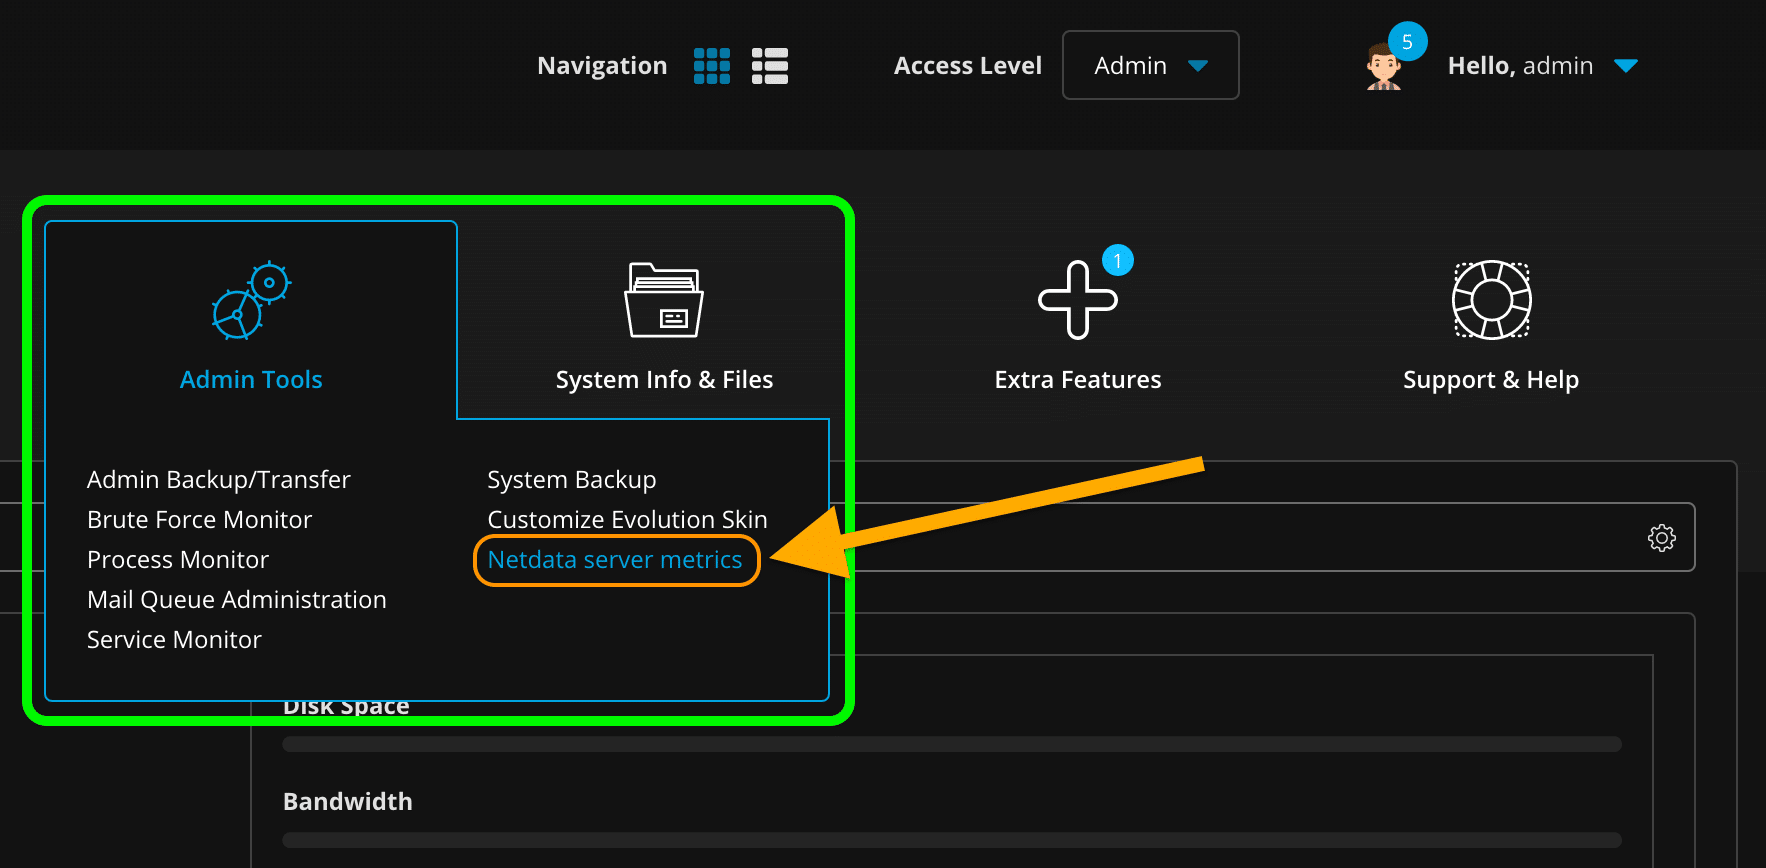
Note: If your DirectAdmin interface does not show this feature, you can check out the error handling for integrating Netdata into DirectAdmin here.
Below is the Netdata interface after you enter the Netdata server metrics feature.
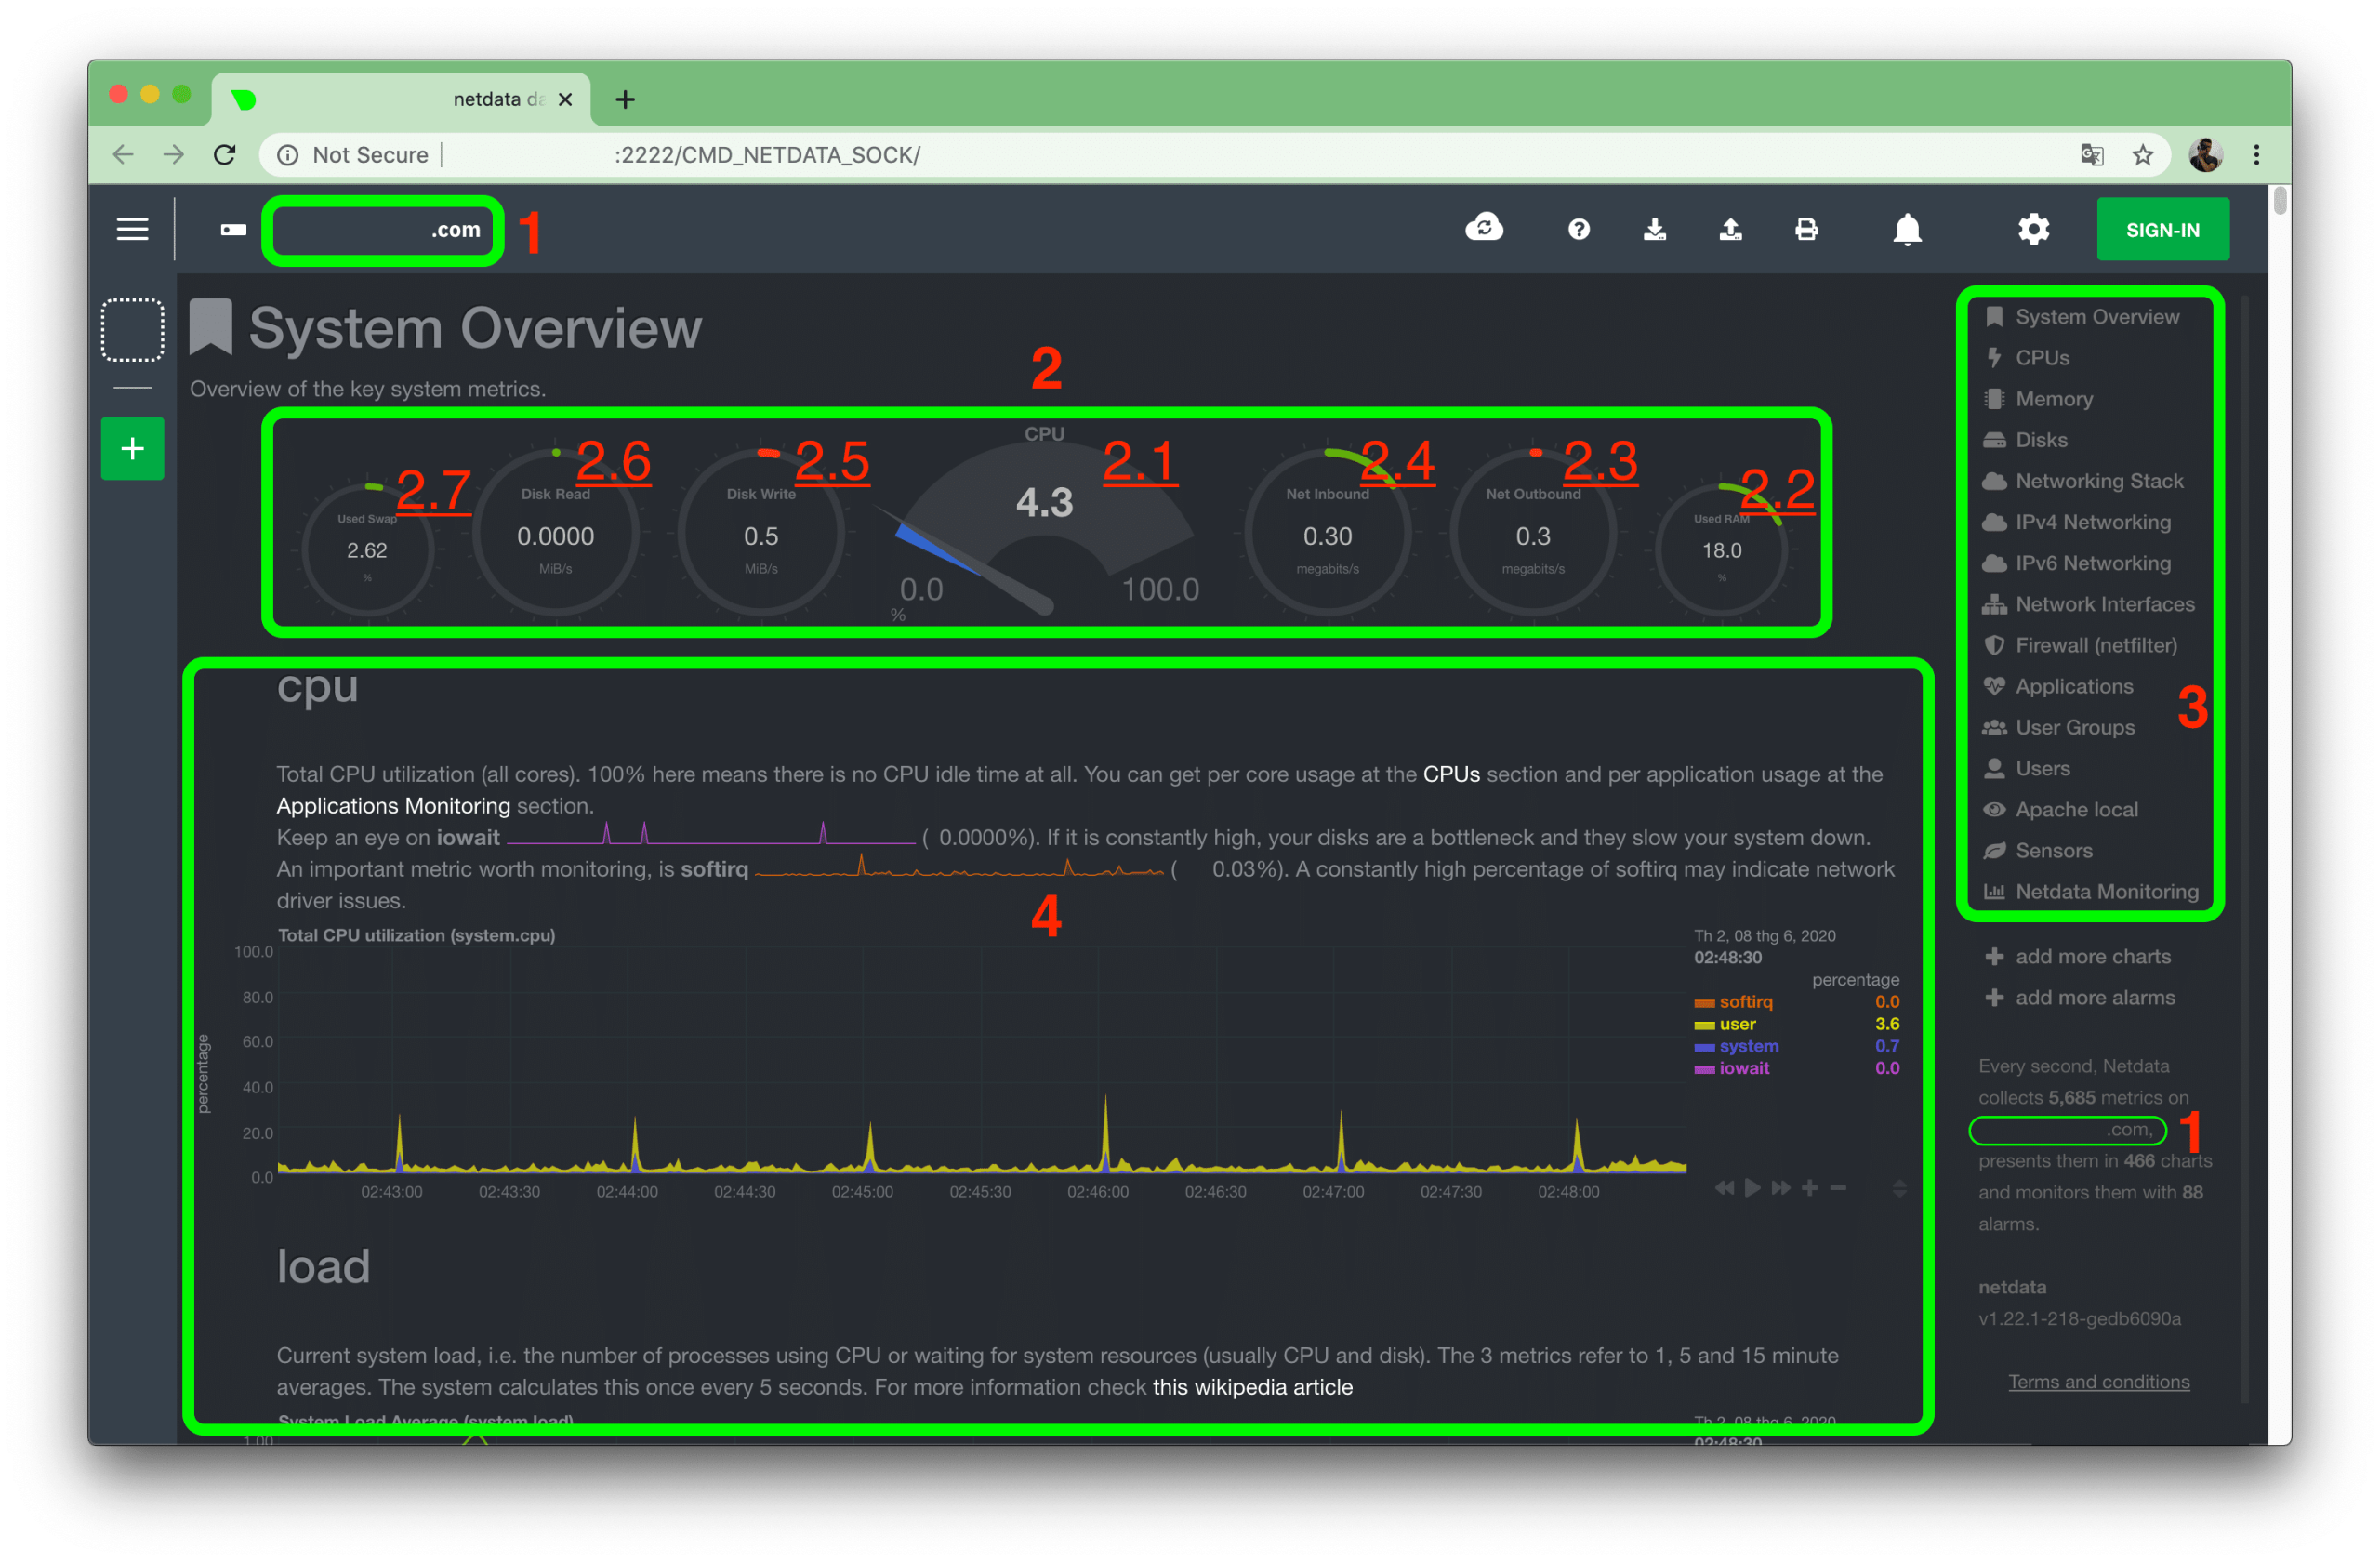
I will explain a bit about the Netdata interface:
- 1: Your VPS/server hostname name.
- 2: The main system parameter table on your VPS/server:
- 2.1: Current CPU usage. From 0.0 to 100.0 is the maximum.
- 2.2: Current RAM usage. Unit
- 2.3: Current outgoing network traffic.
- 2.4: Current inbound network traffic.
- 2.5: Data write speed to current storage hardware.
- 2.6: Data read speed to current storage hardware.
- 2.7: Amount of virtual RAM (SWAP) currently in use.
- 3: Go into the details of the parameters.
- 4: Detailed parameters.
You can use your mouse or hand (on touch screens like iPad, smartphone…) to pull back many previous timelines, this will make it extremely convenient to track the history of system resources.
If you pay attention, you will see a bell in the upper right corner. If something is wrong with your system, this bell will have a tick next to it and you should click to see the warning. As below, there is a warning at (1).

After clicking on the alert, you will get a small window listing all the current alerts. Here, I only have one warning about dropped packets. You can click the locator icon in (2) to quickly move to the chart receiving the current alert, as shown below:

Here you will see the details of how the problem occurred and much more information…
Fix the error of not integrating Netdata into DirectAdmin
If you have done the Netdata integration into Directadmin as in Step 1, but still do not see Netdata server metrics in step 2, you can do it the following way.
Step 1: Check the file netdata.sock exists or not
To check if the file netdata.sock exists or not, use the following command:
ll /var/run/netdata/

If it doesn’t display like the image above, continue with step 2.
Step 2: Restart the Netdata service
To restart the Netdata service, use the following two commands:
service netdata stop
service netdata start
Then recheck the netdata.sock file as step 1. If it already exists, you need Ctrl + F5 DirectAdmin page to see the Netdata server metrics feature.
Thus, the steps to integrate Netdata into DirectAdmin have been completed. Wishing you success.
- Hotline 247: 028 888 24768 (Ext 0)
- Ticket/Email: You use the email to register for the service and send it directly to: support@azdigi.com
You might also like
About the author

Thạch Phạm
Đồng sáng lập và Giám đốc điều hành của AZDIGI. Có hơn 15 năm kinh nghiệm trong phổ biến kiến thức liên quan đến WordPress tại thachpham.com, phát triển website và phát triển hệ thống.