Hello everyone, this is Article 17, the final article in the “Docker from Zero to Hero on VPS” series.
Throughout the previous 16 articles, you have gone from the most basic concepts: What is Docker, what is a container, to building images, writing Dockerfiles, managing volumes, networks, Docker Compose, reverse proxy, CI/CD, monitoring, logging… you now have sufficient foundational knowledge to deploy any application on VPS using Docker.
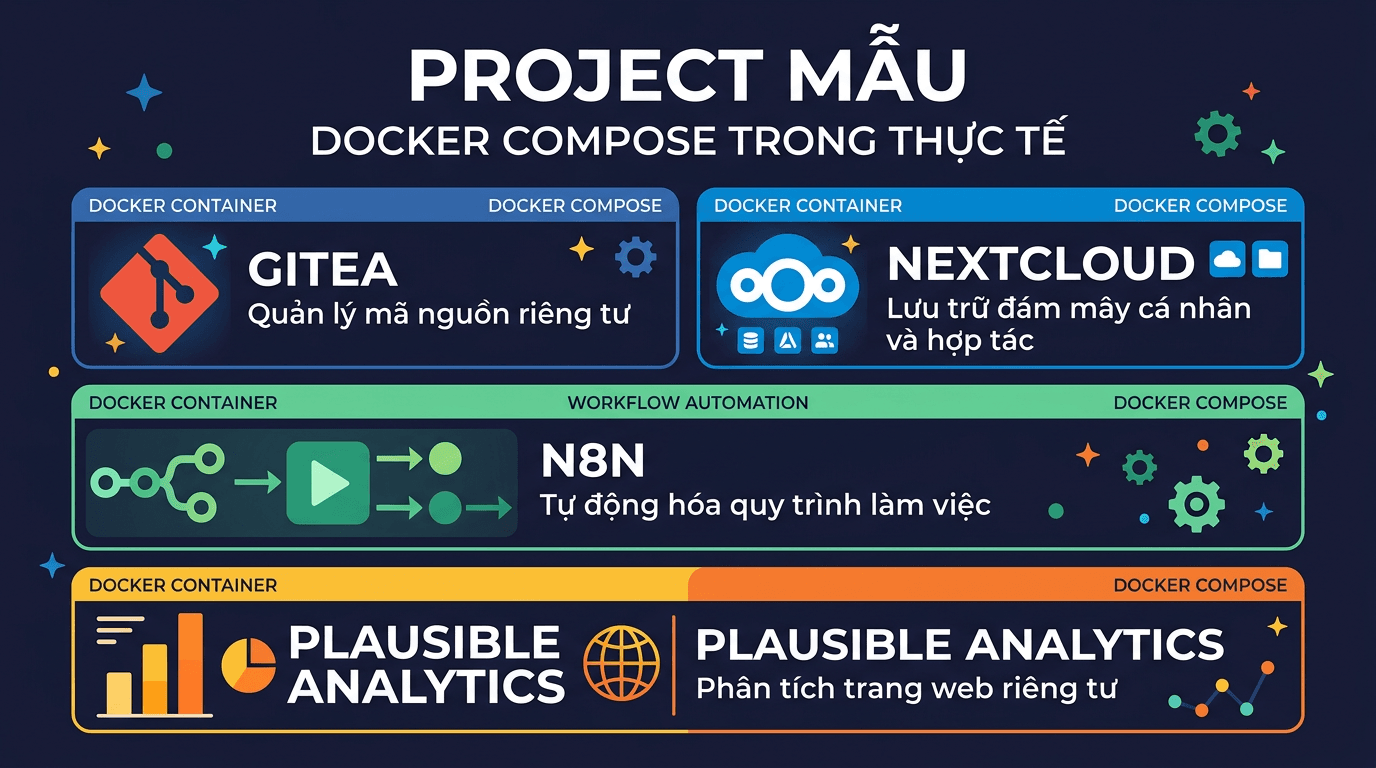
In this final article, I will not teach any new theory. Instead, I will compile 5 practical sample projects that you can copy-paste docker-compose.yml → run immediately on VPS. Each project is a popular, useful self-hosted application that clearly demonstrates what you have learned in the series.
At the end of the article, I will combine everything into a complete VPS setup with Nginx Proxy Manager, truly production-ready style.
Looking back at the 16-article journey
Before we begin, let us review what you have learned:
- Articles 1-3: What is Docker, installing Docker on VPS, basic commands (
docker run,docker ps,docker exec…). - Article 4: Writing Dockerfile: building custom images for applications.
- Article 5: Volume & Network: persistent data and container communication.
- Articles 6-8: Docker Compose: from basics to deploying WordPress, complete LEMP stack.
- Article 9: Environment variables & secrets: secure configuration management.
- Article 10: Reverse proxy: one VPS, multiple domains, automatic SSL.
- Article 11: Deploy Node.js & Python applications with Docker.
- Article 12: Backup & restore: protecting Docker volume data.
- Article 13: Monitoring: Portainer, Uptime Kuma, cAdvisor.
- Article 14: Centralized logging: collecting and managing container logs.
- Articles 15-16: CI/CD, Docker in development workflow, multi-stage build, security best practices.
All of the knowledge above will be applied in the projects below. If you encounter any concepts that are not clear, please return to the corresponding article to review.
Project 1: Gitea – Self-hosted Git server
What is Gitea?
Gitea is a self-hosted Git server, lightweight and fast, which can be seen as a lightweight version of GitHub or GitLab. Gitea is written in Go, runs extremely light (only requires ~200MB RAM), but has complete features: repository management, pull requests, issue tracker, integrated CI/CD (Gitea Actions), and easy-to-use web interface.
If you want to self-host your own private code without depending on GitHub, or need an internal Git server for a small team, Gitea is an excellent choice.
Directory structure
mkdir -p ~/apps/gitea && cd ~/apps/giteadocker-compose.yml
services:
  gitea:
    image: gitea/gitea:latest
    container_name: gitea
    restart: unless-stopped
    ports:
      - "3000:3000"
      - "2222:22"
    environment:
      - USER_UID=1000
      - USER_GID=1000
      - GITEA__database__DB_TYPE=postgres
      - GITEA__database__HOST=gitea-db:5432
      - GITEA__database__NAME=gitea
      - GITEA__database__USER=gitea
      - GITEA__database__PASSWD=gitea_secret_password
    volumes:
      - gitea_data:/data
      - /etc/timezone:/etc/timezone:ro
      - /etc/localtime:/etc/localtime:ro
    depends_on:
      gitea-db:
        condition: service_healthy
    networks:
      - gitea-net
  gitea-db:
    image: postgres:16-alpine
    container_name: gitea-db
    restart: unless-stopped
    environment:
      - POSTGRES_USER=gitea
      - POSTGRES_PASSWORD=gitea_secret_password
      - POSTGRES_DB=gitea
    volumes:
      - gitea_db_data:/var/lib/postgresql/data
    healthcheck:
      test: ["CMD-SHELL", "pg_isready -U gitea"]
      interval: 10s
      timeout: 5s
      retries: 5
    networks:
      - gitea-net
volumes:
  gitea_data:
  gitea_db_data:
networks:
  gitea-net:
Run and initial setup
docker compose up -dAccess http://IP-VPS:3000 in your browser. The first time, Gitea will display the Initial Configuration page. Most database information has been pre-filled from environment variables, you just need to:
- Set Site Title according to your preference.
- Open the Administrator Account Settings section at the bottom of the page to create an admin account.
- Click Install Gitea.
Port 2222 is mapped for SSH, so you can clone repositories via SSH: git clone ssh://git@IP-VPS:2222/user/repo.git.
Docker highlights: This compose file applies depends_on with condition: service_healthy (Article 6), ensuring PostgreSQL is ready before Gitea starts. Volume gitea_data contains all repositories and configuration, gitea_db_data contains the database.
Project 2: Nextcloud – Personal cloud storage
What is Nextcloud?
Nextcloud is a self-hosted cloud storage platform, similar to Google Drive or Dropbox, but data is completely stored on your VPS. Besides file storage, Nextcloud also has calendar, contacts, notes, office suite, and hundreds of extension apps.
This is one of the most popular self-hosted applications in the world, and Docker is the fastest deployment method.
Directory structure
mkdir -p ~/apps/nextcloud && cd ~/apps/nextclouddocker-compose.yml
services:
  nextcloud:
    image: nextcloud:stable
    container_name: nextcloud
    restart: unless-stopped
    ports:
      - "8080:80"
    environment:
      - MYSQL_HOST=nextcloud-db
      - MYSQL_DATABASE=nextcloud
      - MYSQL_USER=nextcloud
      - MYSQL_PASSWORD=nextcloud_secret_password
      - REDIS_HOST=nextcloud-redis
      - NEXTCLOUD_TRUSTED_DOMAINS=your-domain.com
      - OVERWRITEPROTOCOL=https
    volumes:
      - nextcloud_html:/var/www/html
      - nextcloud_data:/var/www/html/data
    depends_on:
      nextcloud-db:
        condition: service_healthy
      nextcloud-redis:
        condition: service_started
    networks:
      - nextcloud-net
  nextcloud-db:
    image: mariadb:11
    container_name: nextcloud-db
    restart: unless-stopped
    command: --transaction-isolation=READ-COMMITTED --log-bin=binlog --binlog-format=ROW
    environment:
      - MYSQL_ROOT_PASSWORD=root_secret_password
      - MYSQL_DATABASE=nextcloud
      - MYSQL_USER=nextcloud
      - MYSQL_PASSWORD=nextcloud_secret_password
    volumes:
      - nextcloud_db_data:/var/lib/mysql
    healthcheck:
      test: ["CMD-SHELL", "healthcheck.sh --connect --innodb_initialized"]
      interval: 10s
      timeout: 5s
      retries: 5
    networks:
      - nextcloud-net
  nextcloud-redis:
    image: redis:7-alpine
    container_name: nextcloud-redis
    restart: unless-stopped
    command: redis-server --requirepass redis_secret_password
    volumes:
      - nextcloud_redis_data:/data
    networks:
      - nextcloud-net
volumes:
  nextcloud_html:
  nextcloud_data:
  nextcloud_db_data:
  nextcloud_redis_data:
networks:
  nextcloud-net:
Run and configure
docker compose up -dAccess http://IP-VPS:8080. The first time, Nextcloud will require creating an admin account. Since the database has been configured through environment variables, you just need to set username/password for admin and click Install.
Configure Trusted Domains
If you access via domain (e.g., cloud.example.com) and encounter “Access through untrusted domain” error, you need to add the domain to the trusted list. The quickest way:
docker exec -u www-data nextcloud php occ config:system:set \
  trusted_domains 1 --value="cloud.example.com"
Or you have already set it via the NEXTCLOUD_TRUSTED_DOMAINS variable in the compose file, just replace your-domain.com with the actual domain before running.
Docker highlights: This project uses 3 services (Nextcloud + MariaDB + Redis), following the multi-service pattern you learned in Articles 6-8. Redis serves as cache to help Nextcloud run significantly faster. Volume nextcloud_data is separated for easy backup (Article 12).
Project 3: n8n – Workflow automation
What is n8n?
n8n (pronounced “n-eight-n”) is a self-hosted workflow automation platform, similar to Zapier or Make.com, but you have complete control over data and are not limited by the number of workflows.
With n8n, you can automate everything: receive webhooks → process data → send to Telegram, sync data between services, scrape web, call APIs, run cron jobs… All through an intuitive drag-and-drop interface.
Directory structure
mkdir -p ~/apps/n8n && cd ~/apps/n8ndocker-compose.yml
services:
  n8n:
    image: n8nio/n8n:latest
    container_name: n8n
    restart: unless-stopped
    ports:
      - "5678:5678"
    environment:
      - DB_TYPE=postgresdb
      - DB_POSTGRESDB_HOST=n8n-db
      - DB_POSTGRESDB_PORT=5432
      - DB_POSTGRESDB_DATABASE=n8n
      - DB_POSTGRESDB_USER=n8n
      - DB_POSTGRESDB_PASSWORD=n8n_secret_password
      - N8N_HOST=n8n.example.com
      - N8N_PROTOCOL=https
      - WEBHOOK_URL=https://n8n.example.com/
      - GENERIC_TIMEZONE=Asia/Ho_Chi_Minh
    volumes:
      - n8n_data:/home/node/.n8n
    depends_on:
      n8n-db:
        condition: service_healthy
    networks:
      - n8n-net
  n8n-db:
    image: postgres:16-alpine
    container_name: n8n-db
    restart: unless-stopped
    environment:
      - POSTGRES_USER=n8n
      - POSTGRES_PASSWORD=n8n_secret_password
      - POSTGRES_DB=n8n
    volumes:
      - n8n_db_data:/var/lib/postgresql/data
    healthcheck:
      test: ["CMD-SHELL", "pg_isready -U n8n"]
      interval: 10s
      timeout: 5s
      retries: 5
    networks:
      - n8n-net
volumes:
  n8n_data:
  n8n_db_data:
networks:
  n8n-net:
Run and configure
docker compose up -dAccess http://IP-VPS:5678, create an admin account, and start creating your first workflow.
Note about Webhook URL
The WEBHOOK_URL variable is very important, it determines the URL that external services will send to n8n. If you use reverse proxy (Article 10), set the correct domain. If only testing locally, you can omit this variable or use http://IP-VPS:5678/.
The N8N_HOST and N8N_PROTOCOL variables also need to match how you access n8n (via domain + HTTPS or IP + HTTP).
Docker highlights: n8n defaults to SQLite, but using PostgreSQL will be more stable when running many workflows. Environment variables here clearly demonstrate how to configure apps through environment variables (Article 9), without needing to edit config files inside containers.
Project 4: Uptime Kuma + Grafana + Prometheus – Monitoring stack
Overview
In Article 13, you got familiar with basic monitoring. Now I will upgrade to a complete monitoring stack:
- Uptime Kuma: monitor uptime of services (HTTP, TCP, DNS, ping…), send alerts via Telegram/Discord/Email.
- Prometheus: collect metrics from exporters (node, container, app…).
- Grafana: visual dashboards, visualize metrics from Prometheus.
Combining these 3 tools, you know both whether services are up (Uptime Kuma) and what resources are like (Prometheus + Grafana).
Directory structure
mkdir -p ~/apps/monitoring && cd ~/apps/monitoringCreate Prometheus configuration file
Before running compose, need to create configuration file for Prometheus:
cat > prometheus.yml << 'EOF'
global:
  scrape_interval: 15s
  evaluation_interval: 15s
scrape_configs:
  - job_name: "prometheus"
    static_configs:
      - targets: ["localhost:9090"]
  - job_name: "node-exporter"
    static_configs:
      - targets: ["node-exporter:9100"]
EOF
This file configures Prometheus to scrape metrics every 15 seconds from itself and from Node Exporter (provides CPU, RAM, disk, network metrics of the VPS).
docker-compose.yml
services:
  uptime-kuma:
    image: louislam/uptime-kuma:latest
    container_name: uptime-kuma
    restart: unless-stopped
    ports:
      - "3001:3001"
    volumes:
      - uptime_kuma_data:/app/data
    networks:
      - monitoring-net
  prometheus:
    image: prom/prometheus:latest
    container_name: prometheus
    restart: unless-stopped
    ports:
      - "9090:9090"
    volumes:
      - ./prometheus.yml:/etc/prometheus/prometheus.yml:ro
      - prometheus_data:/prometheus
    command:
      - "--config.file=/etc/prometheus/prometheus.yml"
      - "--storage.tsdb.retention.time=30d"
    networks:
      - monitoring-net
  node-exporter:
    image: prom/node-exporter:latest
    container_name: node-exporter
    restart: unless-stopped
    pid: host
    volumes:
      - /proc:/host/proc:ro
      - /sys:/host/sys:ro
      - /:/rootfs:ro
    command:
      - "--path.procfs=/host/proc"
      - "--path.sysfs=/host/sys"
      - "--path.rootfs=/rootfs"
      - "--collector.filesystem.mount-points-exclude=^/(sys|proc|dev|host|etc)($$|/)"
    networks:
      - monitoring-net
  grafana:
    image: grafana/grafana:latest
    container_name: grafana
    restart: unless-stopped
    ports:
      - "3002:3000"
    environment:
      - GF_SECURITY_ADMIN_USER=admin
      - GF_SECURITY_ADMIN_PASSWORD=grafana_secret_password
    volumes:
      - grafana_data:/var/lib/grafana
    networks:
      - monitoring-net
volumes:
  uptime_kuma_data:
  prometheus_data:
  grafana_data:
networks:
  monitoring-net:
Run and connect
docker compose up -dAfter running, you have 3 web interfaces:
- Uptime Kuma:
http://IP-VPS:3001: create admin account, add monitors for services you want to track. - Prometheus:
http://IP-VPS:9090: check targets at Status → Targets, ensure both prometheus and node-exporter are UP. - Grafana:
http://IP-VPS:3002: login with admin account set in compose file.
Connect Grafana with Prometheus
In Grafana, add datasource:
- Go to Connections → Data sources → Add data source.
- Choose Prometheus.
- URL:
http://prometheus:9090(use container name since same network). - Click Save & Test.
Then import a ready-made dashboard: go to Dashboards → Import, enter ID 1860 (Node Exporter Full) → select Prometheus datasource → Import. You will have a complete VPS monitoring dashboard immediately.
Docker highlights: This is the compose file with the most services in the article: 4 services running on the same network, communicating via container names. Prometheus mounts config file from host (bind mount, Article 5), Node Exporter mounts /proc and /sys to read system metrics. Everything operates smoothly thanks to Docker network.
Project 5: Ghost Blog - Modern publishing platform
What is Ghost?
Ghost is a modern blog/publishing platform, written in Node.js. Compared to WordPress, Ghost is lighter, faster, and focused on the writing experience. Ghost also supports newsletter, membership, and integrated payments, very suitable for personal blogs or news sites.
Directory structure
mkdir -p ~/apps/ghost && cd ~/apps/ghostdocker-compose.yml
services:
  ghost:
    image: ghost:5
    container_name: ghost
    restart: unless-stopped
    ports:
      - "2368:2368"
    environment:
      - url=https://blog.example.com
      - database__client=mysql
      - database__connection__host=ghost-db
      - database__connection__port=3306
      - database__connection__user=ghost
      - database__connection__password=ghost_secret_password
      - database__connection__database=ghost
      - NODE_ENV=production
    volumes:
      - ghost_content:/var/lib/ghost/content
    depends_on:
      ghost-db:
        condition: service_healthy
    networks:
      - ghost-net
  ghost-db:
    image: mysql:8.0
    container_name: ghost-db
    restart: unless-stopped
    environment:
      - MYSQL_ROOT_PASSWORD=root_secret_password
      - MYSQL_DATABASE=ghost
      - MYSQL_USER=ghost
      - MYSQL_PASSWORD=ghost_secret_password
    volumes:
      - ghost_db_data:/var/lib/mysql
    healthcheck:
      test: ["CMD-SHELL", "mysqladmin ping -h localhost"]
      interval: 10s
      timeout: 5s
      retries: 5
    networks:
      - ghost-net
volumes:
  ghost_content:
  ghost_db_data:
networks:
  ghost-net:
Run and access
docker compose up -dAccess http://IP-VPS:2368 to view the blog. Admin page is at http://IP-VPS:2368/ghost: create admin account the first time.
Important note: The url variable must match the actual domain you will use. If just testing, use http://IP-VPS:2368. When bringing to production with domain + SSL, change to https://blog.example.com.
Volume ghost_content contains all themes, images, and uploaded files. This is the most important volume to backup.
Docker highlights: Ghost uses nested environment variables (database__connection__host), a common approach in many Node.js apps. The compose file is simple but sufficient for production.
Full VPS Setup - Combining everything with Nginx Proxy Manager
Now for the best part: combining all 5 projects above + Nginx Proxy Manager into a complete system on VPS. Each app accessed via its own subdomain, automatic SSL, running in parallel without conflicts.
Recommended directory structure
~/apps/
├── nginx-proxy-manager/
│   └── docker-compose.yml
├── gitea/
│   └── docker-compose.yml
├── nextcloud/
│   └── docker-compose.yml
├── n8n/
│   └── docker-compose.yml
├── monitoring/
│   ├── docker-compose.yml
│   └── prometheus.yml
└── ghost/
    └── docker-compose.yml
Principle: Each app in one directory, one compose file. Easy to manage, easy to backup, easy to delete, no app affects another.
Step 1: Create shared proxy network
All apps need to connect with Nginx Proxy Manager via a shared network. Create this network first:
docker network create proxy-networkThis network is created manually outside compose files (external network), so it exists independently, not deleted when you docker compose down any app.
Step 2: Nginx Proxy Manager
mkdir -p ~/apps/nginx-proxy-manager && cd ~/apps/nginx-proxy-manager# ~/apps/nginx-proxy-manager/docker-compose.yml
services:
npm:
image: jc21/nginx-proxy-manager:latest
container_name: nginx-proxy-manager
restart: unless-stopped
ports:
- "80:80"
- "443:443"
- "81:81"
volumes:
- npm_data:/data
- npm_letsencrypt:/etc/letsencrypt
networks:
- proxy-network
volumes:
npm_data:
npm_letsencrypt:
networks:
proxy-network:
external: truedocker compose up -dAccess http://IP-VPS:81, login the first time with email admin@example.com / password changeme, then immediately change login information.
Step 3: Edit compose file for each app
To connect each app with Nginx Proxy Manager, you need to edit 2 things in each compose file:
1. Remove ports section (no longer expose ports outside, proxy will handle):
# Delete or comment ports line
# ports:
#   - "3000:3000"
2. Add proxy-network for main service:
services:
  gitea:
    # ... keep other configs unchanged ...
    networks:
      - gitea-net
      - proxy-network    # Add this line
# ... keep internal networks section unchanged ...
networks:
  gitea-net:
  proxy-network:         # Add this block
    external: true
Do the same for each app: nextcloud, n8n, ghost, uptime-kuma, grafana. Only the main service (the one needing web access) needs to join proxy-network: database, redis don't need it.
Example: Gitea with proxy-network
Here is the Gitea compose file edited for production:
services:
  gitea:
    image: gitea/gitea:latest
    container_name: gitea
    restart: unless-stopped
    # Don't expose HTTP port — proxy will forward
    ports:
      - "2222:22"  # Keep SSH port
    environment:
      - USER_UID=1000
      - USER_GID=1000
      - GITEA__database__DB_TYPE=postgres
      - GITEA__database__HOST=gitea-db:5432
      - GITEA__database__NAME=gitea
      - GITEA__database__USER=gitea
      - GITEA__database__PASSWD=gitea_secret_password
      - GITEA__server__ROOT_URL=https://git.example.com/
    volumes:
      - gitea_data:/data
      - /etc/timezone:/etc/timezone:ro
      - /etc/localtime:/etc/localtime:ro
    depends_on:
      gitea-db:
        condition: service_healthy
    networks:
      - gitea-net
      - proxy-network
  gitea-db:
    image: postgres:16-alpine
    container_name: gitea-db
    restart: unless-stopped
    environment:
      - POSTGRES_USER=gitea
      - POSTGRES_PASSWORD=gitea_secret_password
      - POSTGRES_DB=gitea
    volumes:
      - gitea_db_data:/var/lib/postgresql/data
    healthcheck:
      test: ["CMD-SHELL", "pg_isready -U gitea"]
      interval: 10s
      timeout: 5s
      retries: 5
    networks:
      - gitea-net
volumes:
  gitea_data:
  gitea_db_data:
networks:
  gitea-net:
  proxy-network:
    external: true
Step 4: Create Proxy Host in NPM
For each app, go to Nginx Proxy Manager → Proxy Hosts → Add Proxy Host:
- Domain:
git.example.com - Forward Hostname:
gitea(container name) - Forward Port:
3000(internal port of container) - SSL: Request new SSL certificate → Force SSL → HSTS
Do the same for other apps:
cloud.example.com→ containernextcloud, port80n8n.example.com→ containern8n, port5678status.example.com→ containeruptime-kuma, port3001grafana.example.com→ containergrafana, port3000blog.example.com→ containerghost, port2368
Remember to point DNS for all subdomains to VPS IP before creating proxy hosts.
Daily management
With this structure, each app is completely independent:
# Restart only Gitea (doesn't affect other apps)
cd ~/apps/gitea && docker compose restart
# Update Ghost to new version
cd ~/apps/ghost && docker compose pull && docker compose up -d
# Completely remove n8n (keep data if wanted)
cd ~/apps/n8n && docker compose down
# View Nextcloud logs
cd ~/apps/nextcloud && docker compose logs -f nextcloud
# Backup all volumes
for app in gitea nextcloud n8n monitoring ghost; do
  cd ~/apps/$app && docker compose stop
  # backup volumes...
  docker compose start
done
Summary: What did you learn from these 5 projects?
Each project above demonstrates one or more concepts from the series:
- Multi-service compose: app + database + cache, managed by 1 file only.
- Named volumes: persistent data, easy backup, easy migration.
- Environment variables: configure apps without editing code or config files.
- Docker networks: services communicate via container names, isolate traffic.
- Health checks & depends_on: ensure correct startup order.
- Reverse proxy: multiple apps, multiple domains, one VPS, automatic SSL.
- External networks: share networks between separate compose files.
If you understand all these patterns, you can deploy almost any application on VPS with Docker.
📚 Docker Series from A to Z
- Article 1: What is Docker? Why use Docker on VPS
- Article 2: Install Docker and Docker Compose on Ubuntu VPS
- Article 3: Getting familiar with Docker - Essential basic commands
- Article 4: Docker Image & Dockerfile - Create your own Image
- Article 5: Docker Volume & Network - Data and network management
- Article 6: What is Docker Compose? Installation and basic syntax
- Article 7: Deploy WordPress + MySQL + phpMyAdmin with Docker Compose
- Article 8: Deploy LEMP Stack (Nginx + PHP-FPM + MariaDB) with Docker Compose
- Article 9: Environment variables & .env file in Docker Compose
- Article 10: Reverse Proxy with Nginx Proxy Manager + automatic SSL
- Article 11: Deploy Node.js / Python applications with Docker Compose
- Article 12: Backup & Restore Docker Volume data
- Article 13: Monitoring Docker with Portainer, Uptime Kuma and cAdvisor
- Article 14: Docker Logging - Efficient log management
- Article 15: Docker security on VPS
- Article 16: Simple CI/CD - Auto deploy with Webhook + Docker Compose
- Article 17: Docker Compose in practice - Sample project collection (currently reading)
Series conclusion - Docker from Zero to Hero
17 articles. From the question "What is Docker?" to running an entire multi-app system on VPS with reverse proxy, monitoring, logging, backup, and CI/CD.
Let us look back at the journey you have taken:
- Articles 1-3: Understanding Docker, installation, running first container.
- Articles 4-5: Dockerfile, volume, network: core foundation.
- Articles 6-9: Docker Compose, deploying WordPress, LEMP, environment variable management.
- Articles 10-11: Reverse proxy, deploying Node.js/Python apps.
- Articles 12-14: Backup, monitoring, logging: production operations.
- Articles 15-16: CI/CD, security, multi-stage build: professionalization.
- Article 17: Sample project collection: practical application.
That is a solid amount of knowledge. You can now confidently say: "I know how to use Docker."
What comes next?
Docker on single VPS is the foundation. From here, there are many directions for you to continue:
- Docker Swarm: run Docker across multiple VPS, automatic load balancing and failover. If you are familiar with Docker Compose, Swarm will be very easy to approach since it uses the same compose file format.
- Kubernetes (K8s): orchestration at larger scale. More complex than Swarm, but is the industry standard for enterprise-scale production.
- Advanced CI/CD: GitHub Actions, GitLab CI, or Gitea Actions (self-hosted too!) to automatically build → test → deploy whenever you push code.
- Container security: scan images with Trivy, run rootless containers, AppArmor/Seccomp profiles, image signing.
Reference materials
- Docker Docs: https://docs.docker.com/: official documentation, always updated.
- Awesome Docker: https://github.com/veggiemonk/awesome-docker: compilation of tools, resources, best practices.
- Awesome Self-Hosted: https://github.com/awesome-selfhosted/awesome-selfhosted: list of thousands of self-hosted applications, most have Docker images.
- r/selfhosted: https://reddit.com/r/selfhosted: largest self-hosting community, where to find new project ideas.
Choosing the right VPS for Docker
All projects in this series are designed to run on VPS. For the best experience with Docker, you should choose VPS with:
- Minimum 2GB RAM: enough for 3-5 small apps. 4GB+ if running many apps like in this article.
- SSD/NVMe storage: Docker build and pull images much faster than HDD.
- High-speed network: pull images fast, low response time for reverse proxy.
- Ubuntu 22.04+ or Debian 12+: best Docker support.
VPS at AZDIGI meets all the above criteria, SSD NVMe, high-speed network, 24/7 Vietnamese technical support. If you are looking for VPS to practice Docker or deploy production, you can check out VPS packages at https://azdigi.com/x-platinum-vps/.
Thank you for following the "Docker from Zero to Hero on VPS" series from Article 1 to Article 17 by AZDIGI.
I hope this series helps you master Docker and apply it immediately to your work. From the first docker run commands to managing an entire multi-app system on VPS, you have come a long way.
Docker is not difficult. It just requires you to start doing it, gradually it will become a habit. And once you are used to it, you will not want to go back to manual installation methods. 😄
Happy deploying! 🐳
👈 Previous article: Simple CI/CD - Auto deploy with Webhook + Docker Compose
You might also like
- Install Open WebUI + Ollama with Docker Compose - Create Your Own ChatGPT on VPS
- How to install Nginx Proxy Manager with Docker Compose on Ubuntu 22.04
- One-Click Services on Coolify — Deploy 294+ services with just 1 click
- Install and use Docker Compose on Ubuntu 22.04
- Deploy Docker Compose on Coolify - Complex multi-container applications
- Installing Dify AI on VPS - Free No-code AI Platform
About the author

Trần Thắng
Expert at AZDIGI with years of experience in web hosting and system administration.