Nội dung
In this article, AZDIGI will show you how to install iftop and use it.
I. Introduction
In my previous article, AZDIGI introduced nload as a tool for monitoring bandwidth usage, but it’s relatively simple and doesn’t go into much detail. In this article, AZDIGI will introduce another excellent program called Interface TOP (IFTOP) which is a detailed real-time network bandwidth monitoring tool on Linux.
It will display quick information about network activities on an interface. Iftop will display a list of network bandwidth-consuming processes updated in real-time averaging every 2, 10, and 40 seconds. In this guide, I will guide you on how to install and use IFTOP with some examples on Linux.
II. Install iftop on the Linux server
Before going through the installation steps, we need to install the required dependencies for iftop. 2 libraries that need to be installed are:
- libpcap: Library for directly collecting network data.
- libncurses: The programming library that provides API for building text-based interfaces.
Step 1: Install libpcap and libncurses
First, let’s start by installing the libpcap and libncurses libraries with the following commands:
-------- Trên máy chủ Debian/Ubuntu --------
sudo apt install libpcap0.8 libpcap0.8-dev libncurses5 libncurses5-dev

-------- Trên máy chủ CentOS 7/RHEL --------
yum  -y install libpcap libpcap-devel ncurses ncurses-devel

-------- Trên máy chủ Fedora 22+ --------
dnf  -y install libpcap libpcap-devel ncurses ncurses-devel
Step 2: Install iftop
This software is available in the official software repository of Debian/Ubuntu Linux, so you can install it with the apt command as follows:
sudo apt install iftop
In RHEL/CentOS 6&7, you need to enable the EPEL repository, then install it with the following two commands:
yum install epel-release -y
yum install  iftop -y
CentOS 8 and Fedora are also available on the repositories so you just need to use the following command:
dnf install iftop -y
Below I’m using a CentOS 8 VPS to install.
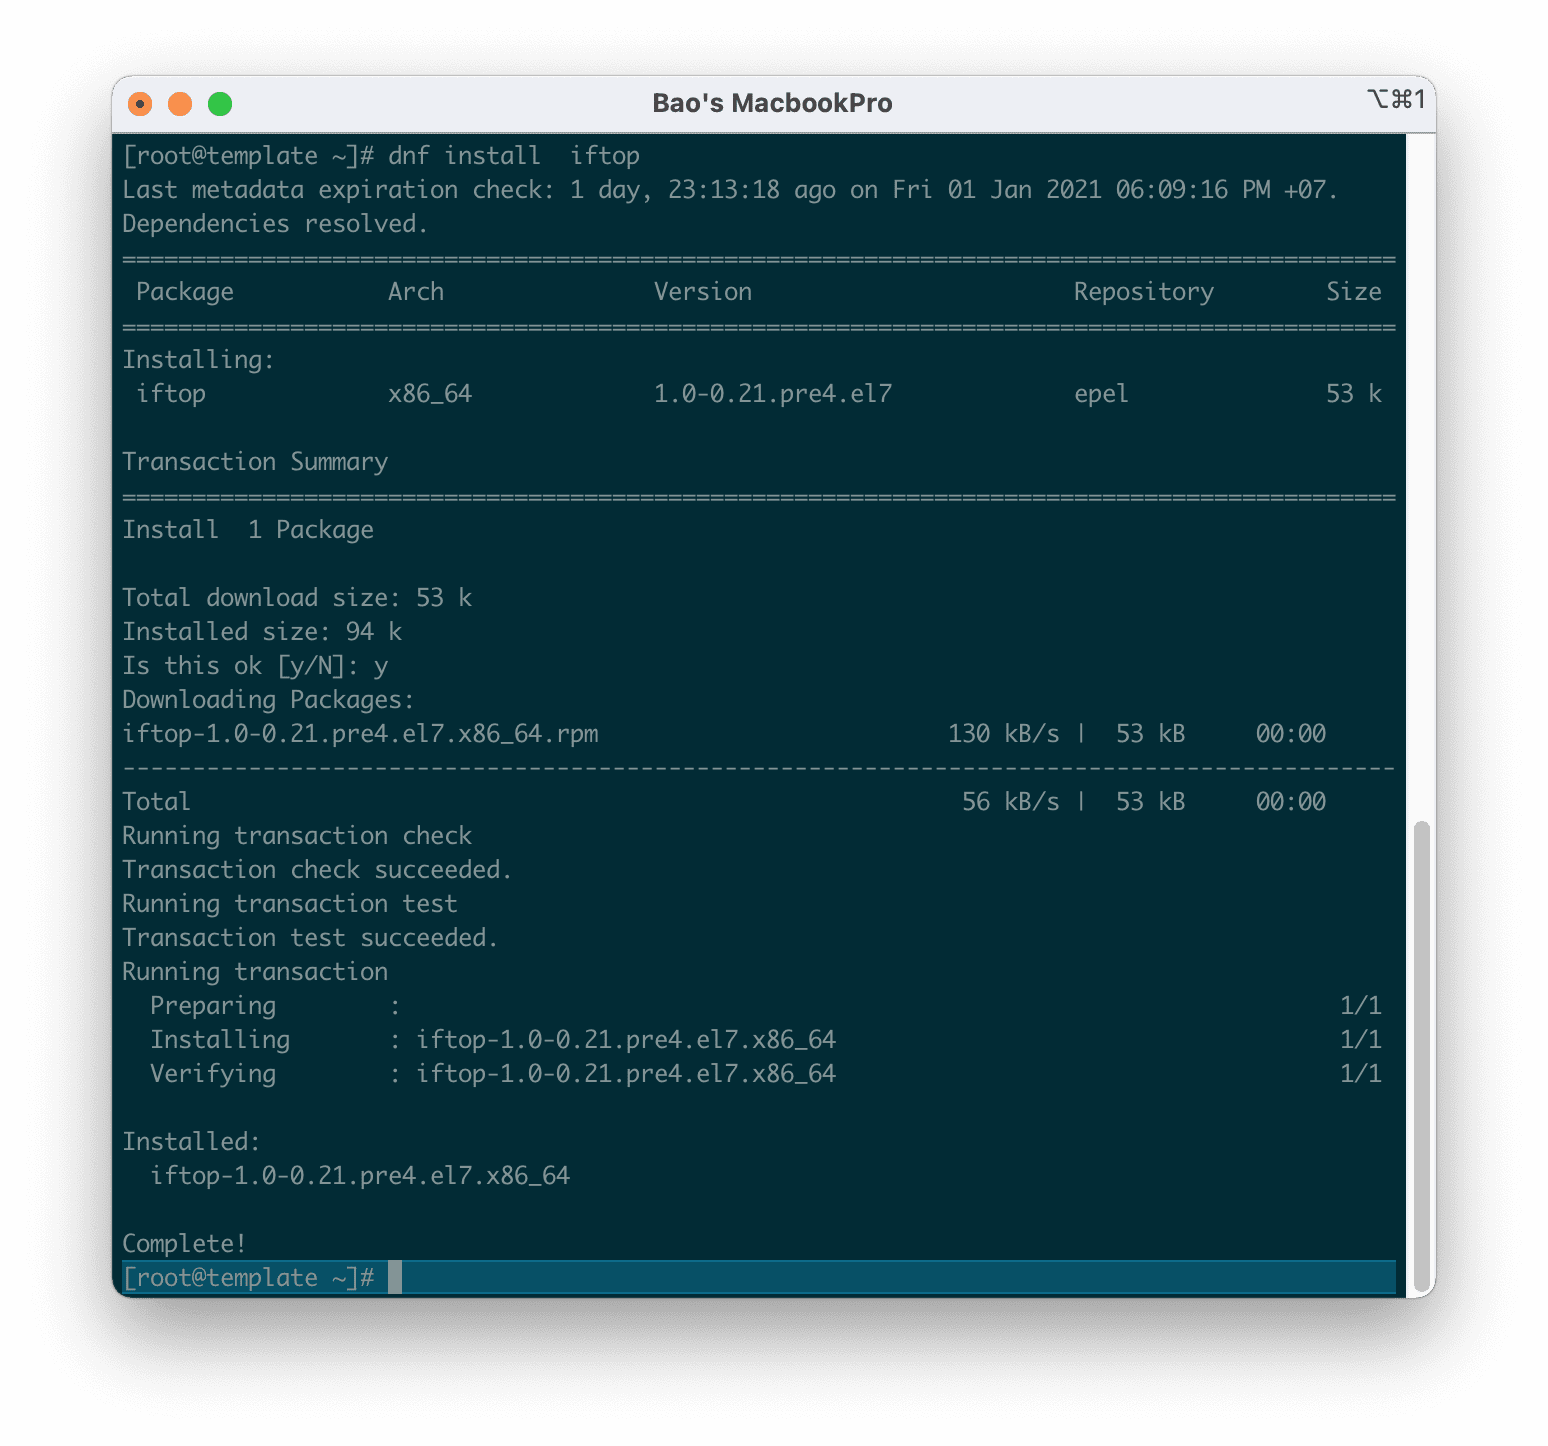
In case you are using other Linux versions, you can download the source code of iftop and recompile it for use with the following commands:
wget http://www.ex-parrot.com/pdw/iftop/download/iftop-1.0pre4.tar.gz
tar -zxvf iftop-1.0pre4.tar.gz
cd iftop-0.17
./configure
make
make install
You can replace the download link with the higher version at this link.
III. Guide to using iftop
Basic use
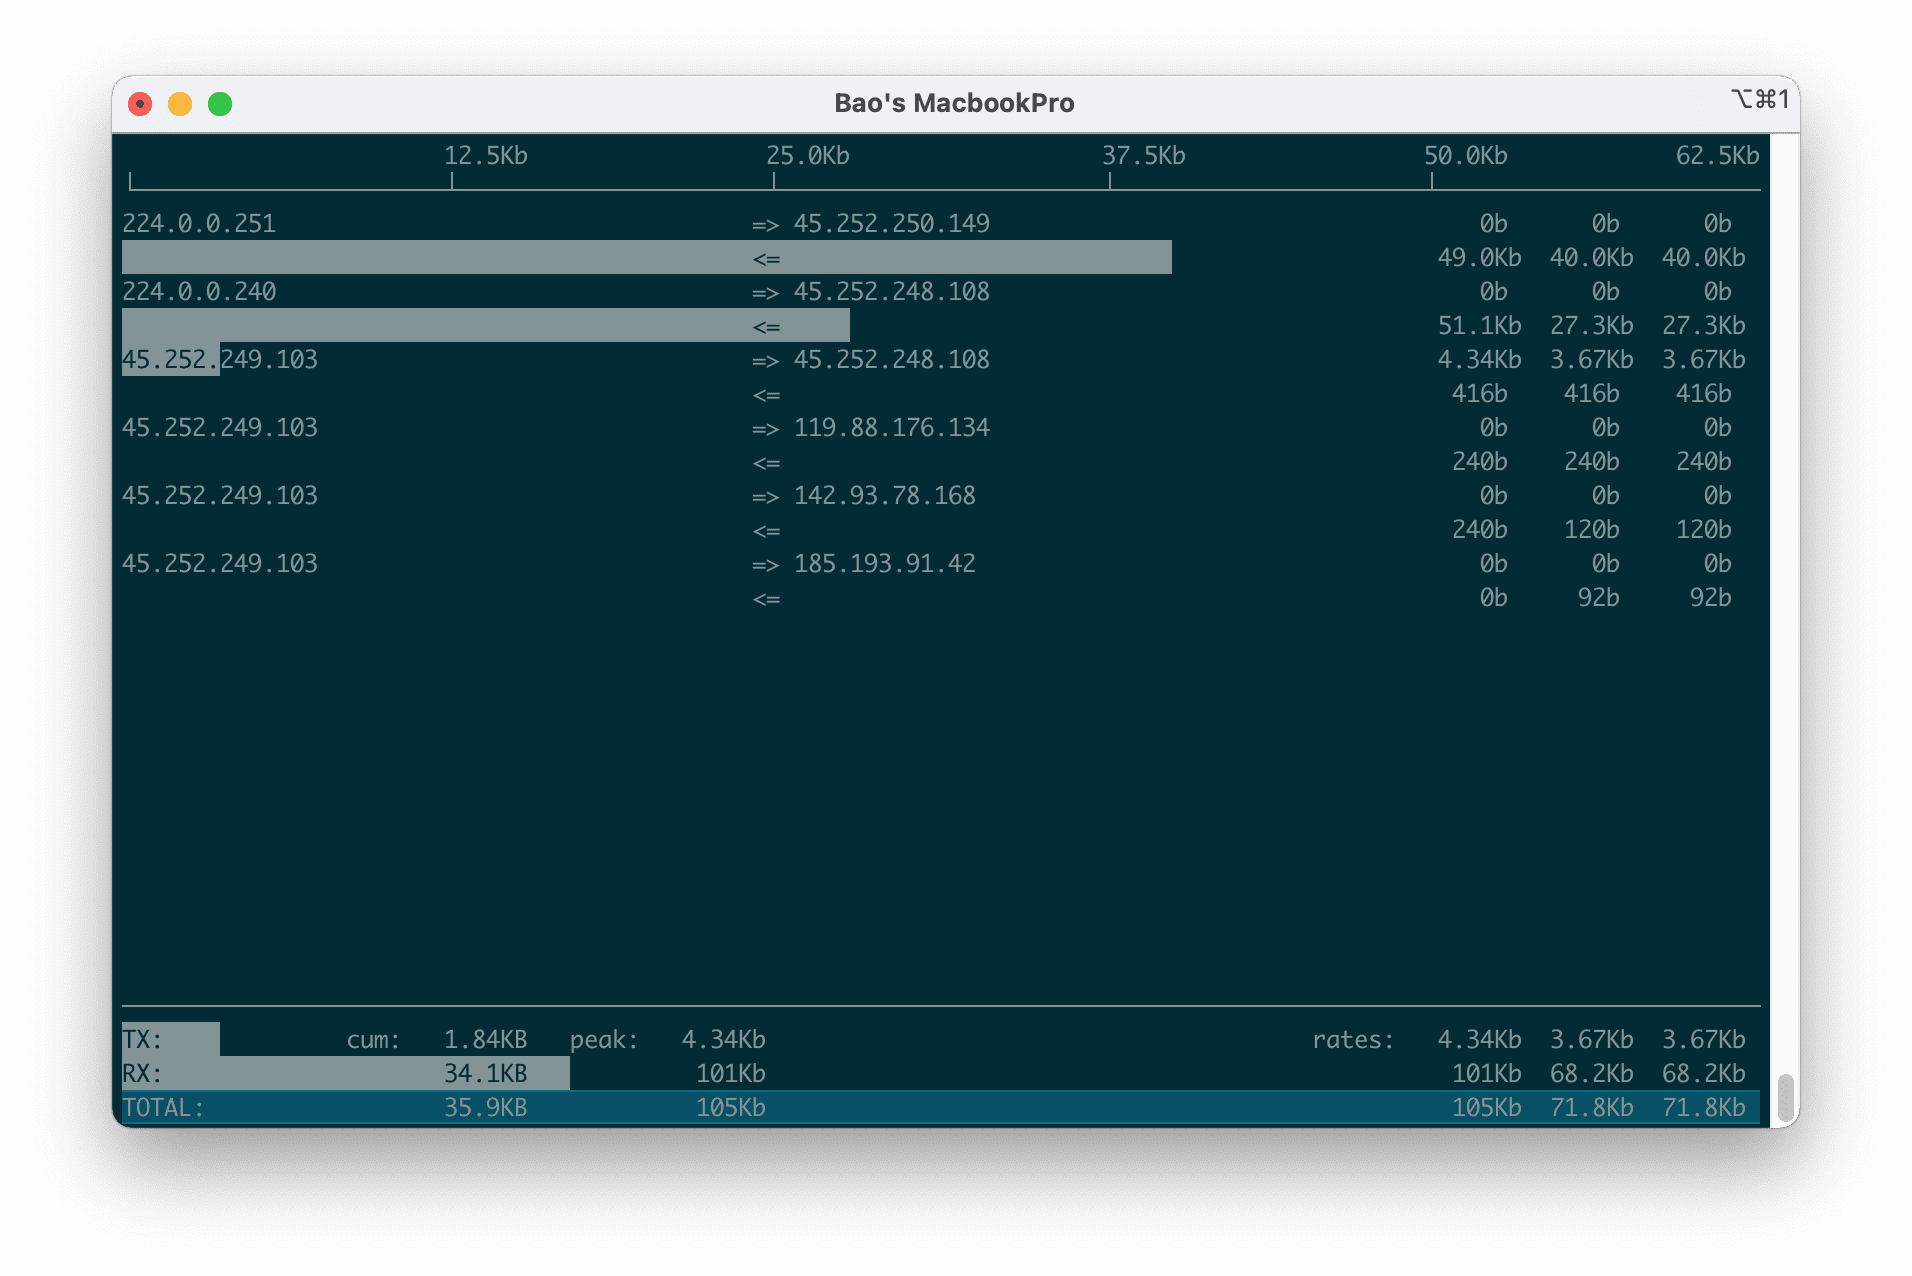
Once it’s installed, go to your control panel and run the iftop command to see the bandwidth usage of the default theme, below is the interface of use:
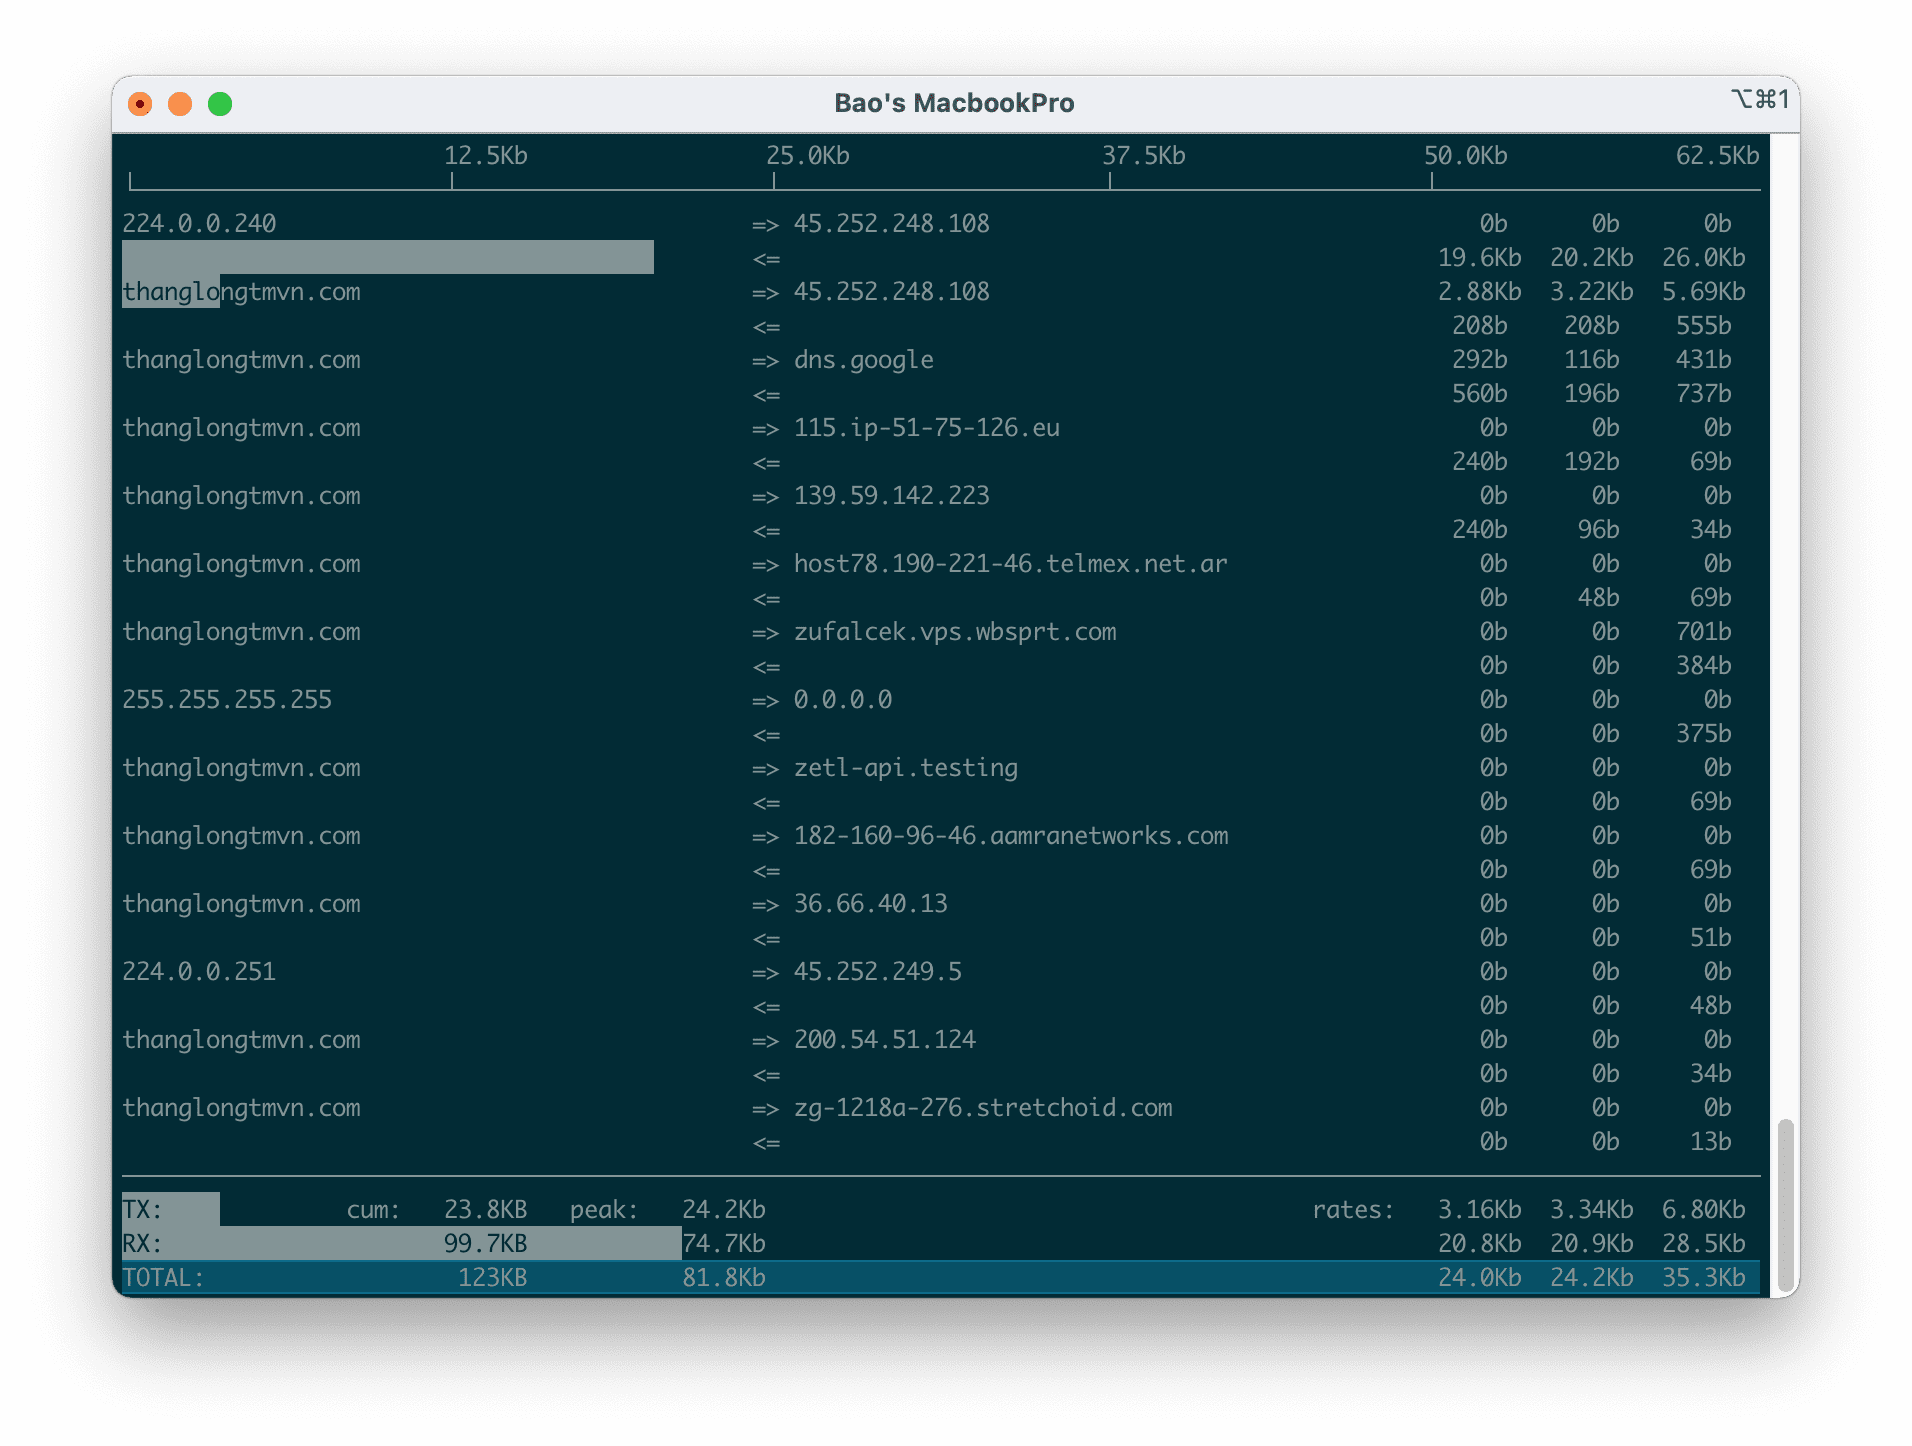
At this interface, you can see which IP is connecting to your server and how much bandwidth your server is using, whether it’s high or low.
Use to monitor a certain network card
First, you need to determine how many network cards your server has and what each network card name is with one of the following two commands:
sudo ifconfig
Hoặc
sudo ip addr show
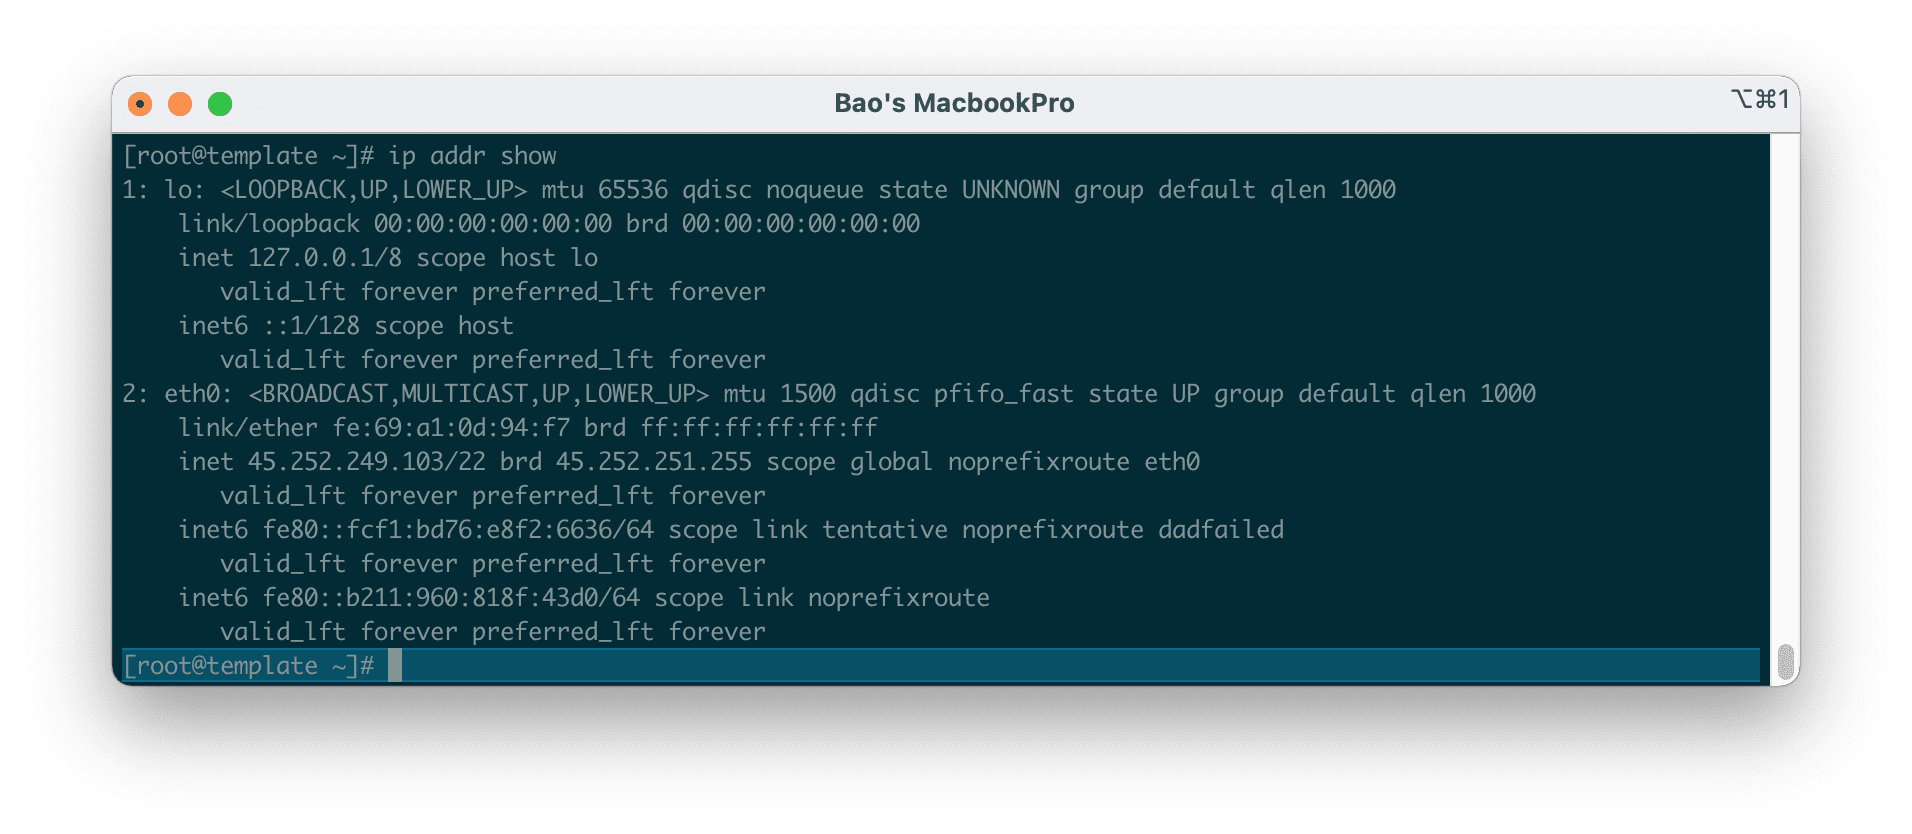
Then you just need to add the -i option and the name of the network card you want to track. For example, if I want to track my eth0 card, I will use the following command:
sudo iftop -i eth0
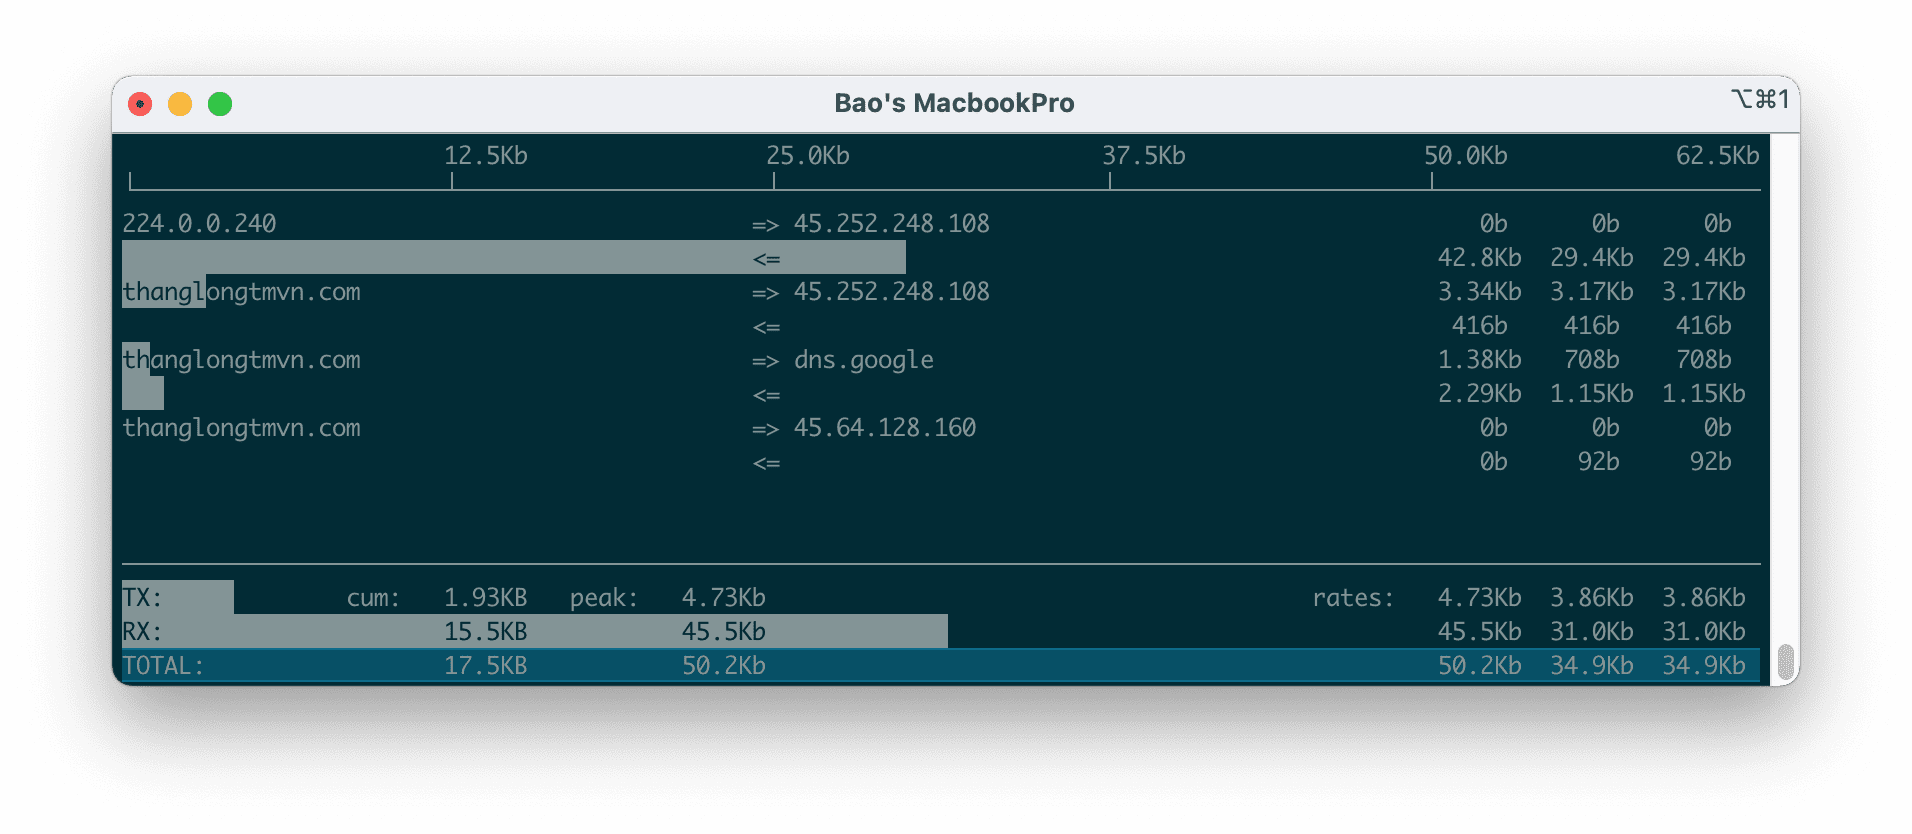
To disable hostname lookup, add the -n option in your command line.
sudo iftop -n -i eth0
Hoặc
sudo iftop -ni eth0
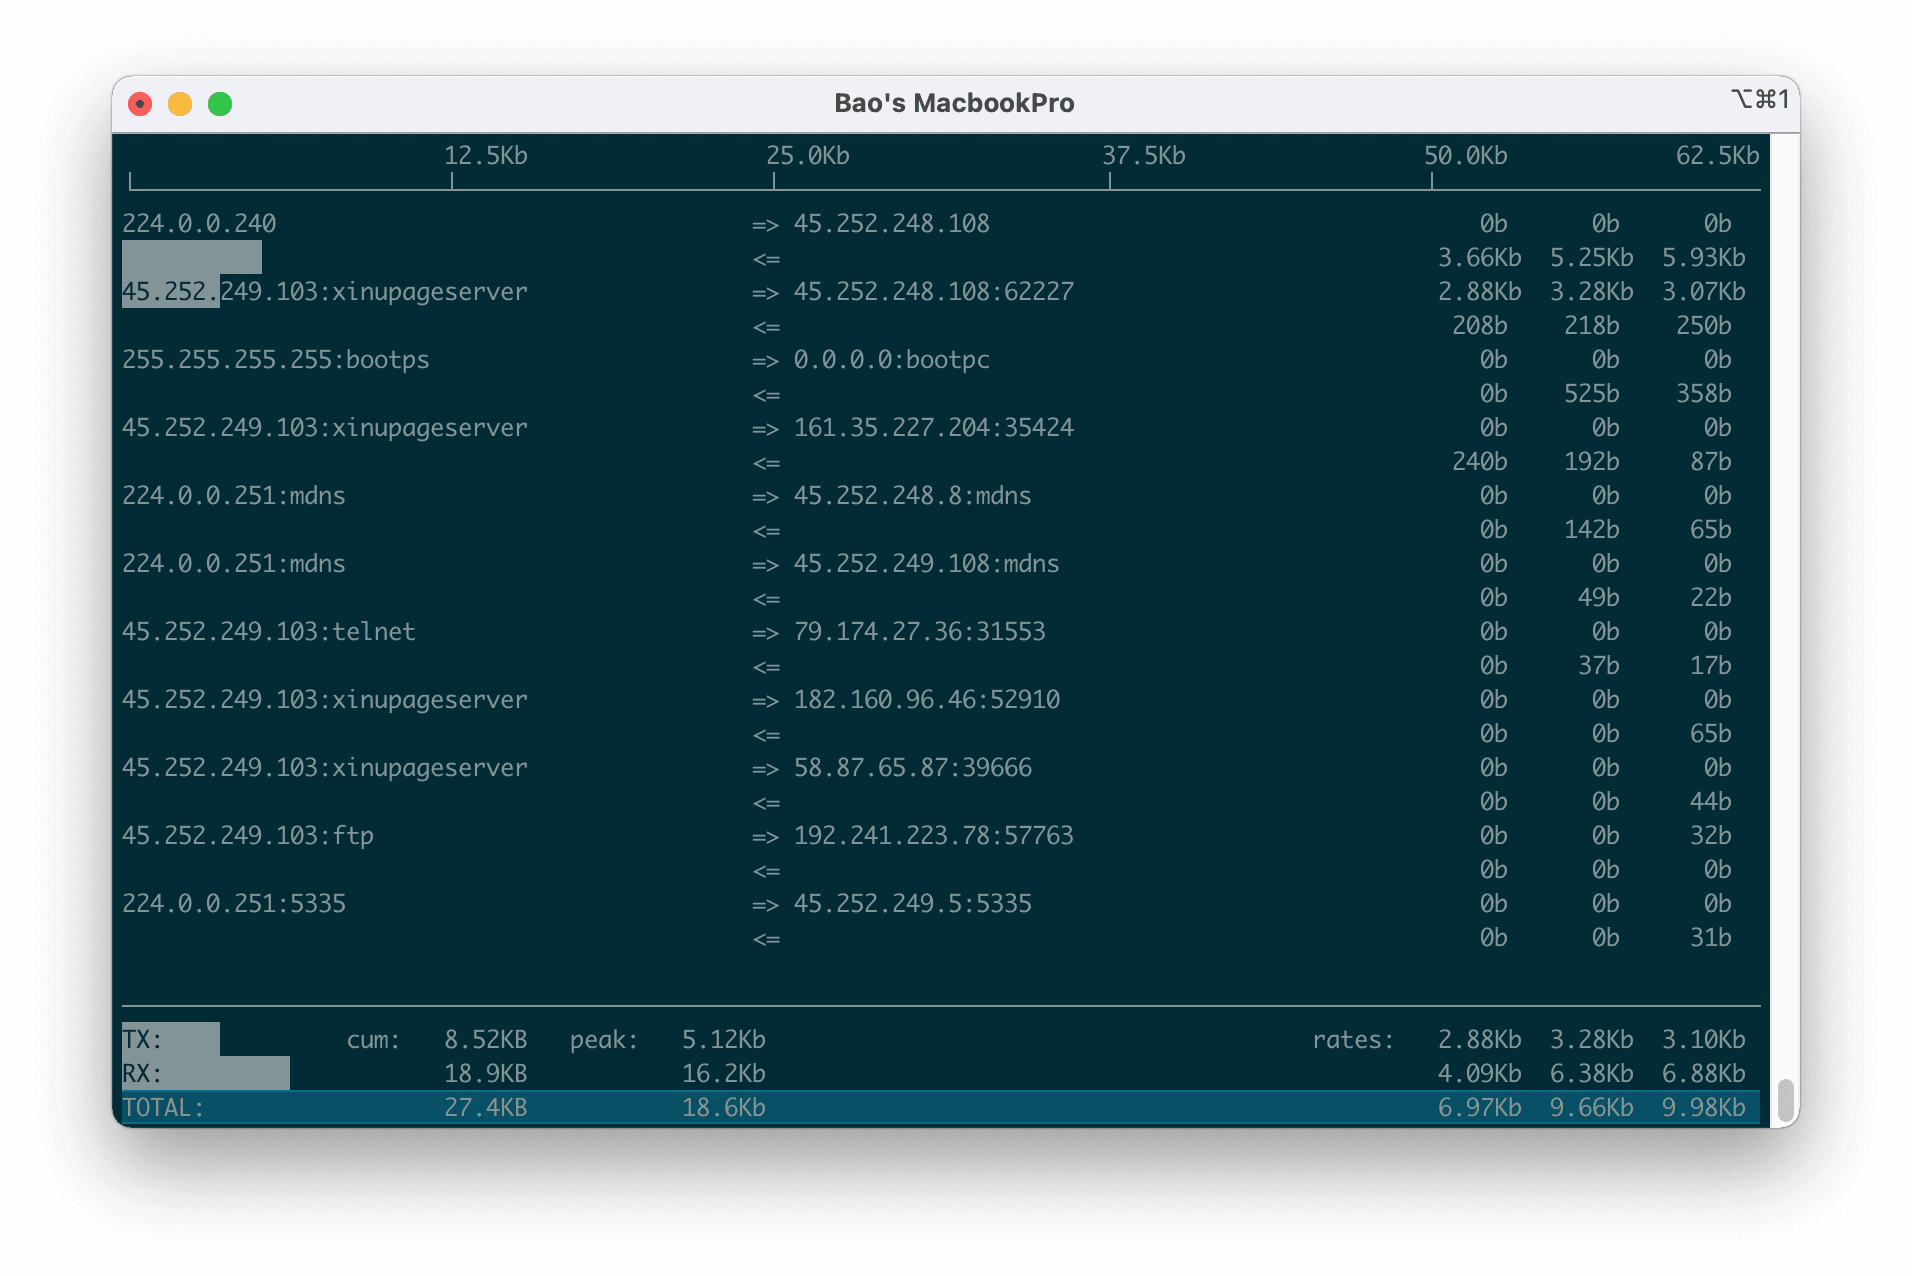
To enable more information about the port in use, please use the -P option.
sudo iftop -P -n -i eth0
Hoặc
sudo iftop -Pni eth0
Some more options
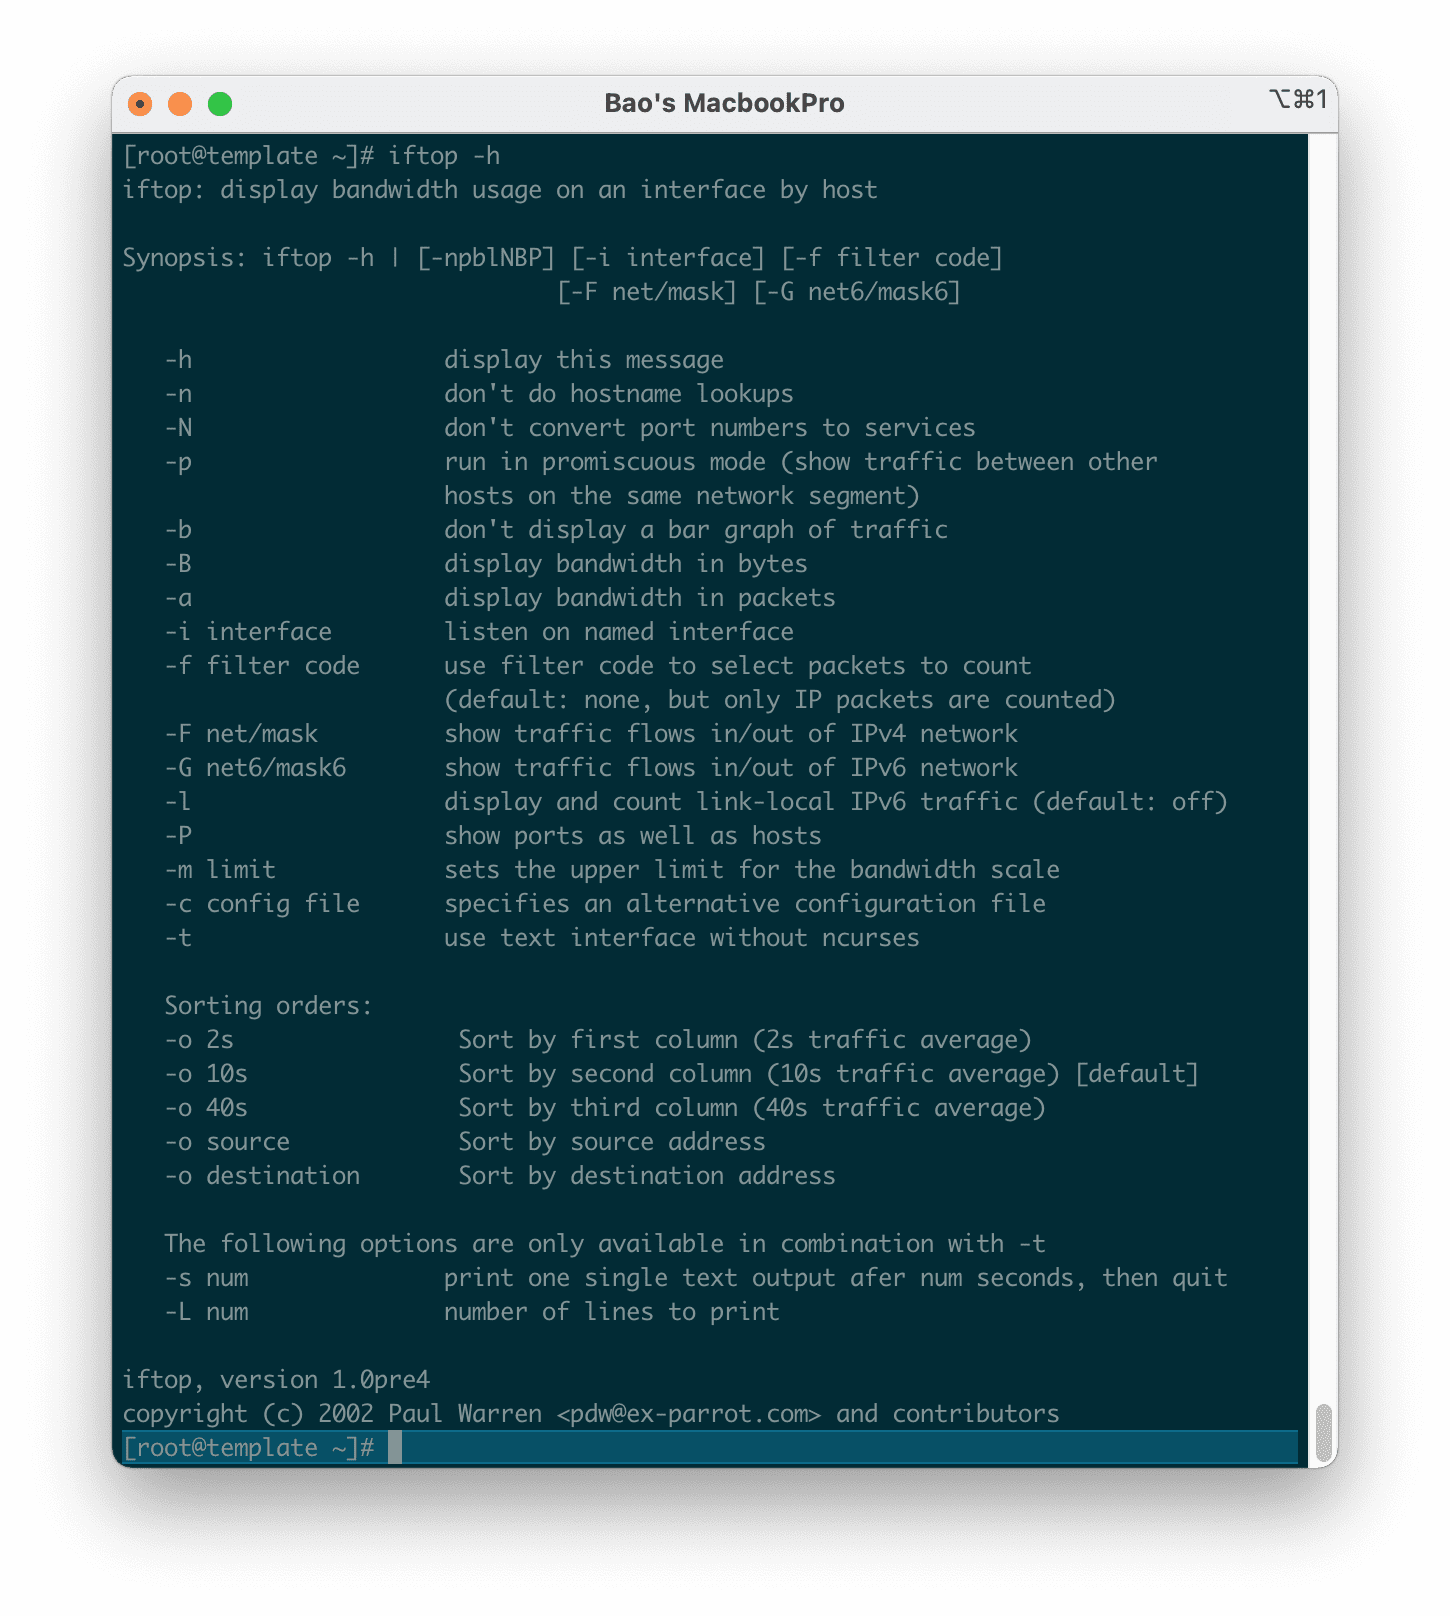
While using iftop, you can use keys like S, D to view more information like source, destination, etc. Run iftop -h f you want to explore more options and tricks. Press q to exit running windows.
iftop -h
IV. Summary
Hopefully, through this article, you will learn about another useful tool to better manage your server. If you are still interested in monitoring software, you can check out the following articles:
If you need assistance, you can contact support in the ways below:
- Hotline 247: 028 888 24768 (Ext 0)
- Ticket/Email: You use the email to register for the service and send it directly to: support@azdigi.com .

