
Continuing the Zabbix Series, in this article, AZDIGI will show you how to monitor your server with Zabbix Server very simply.
Configuration Guide
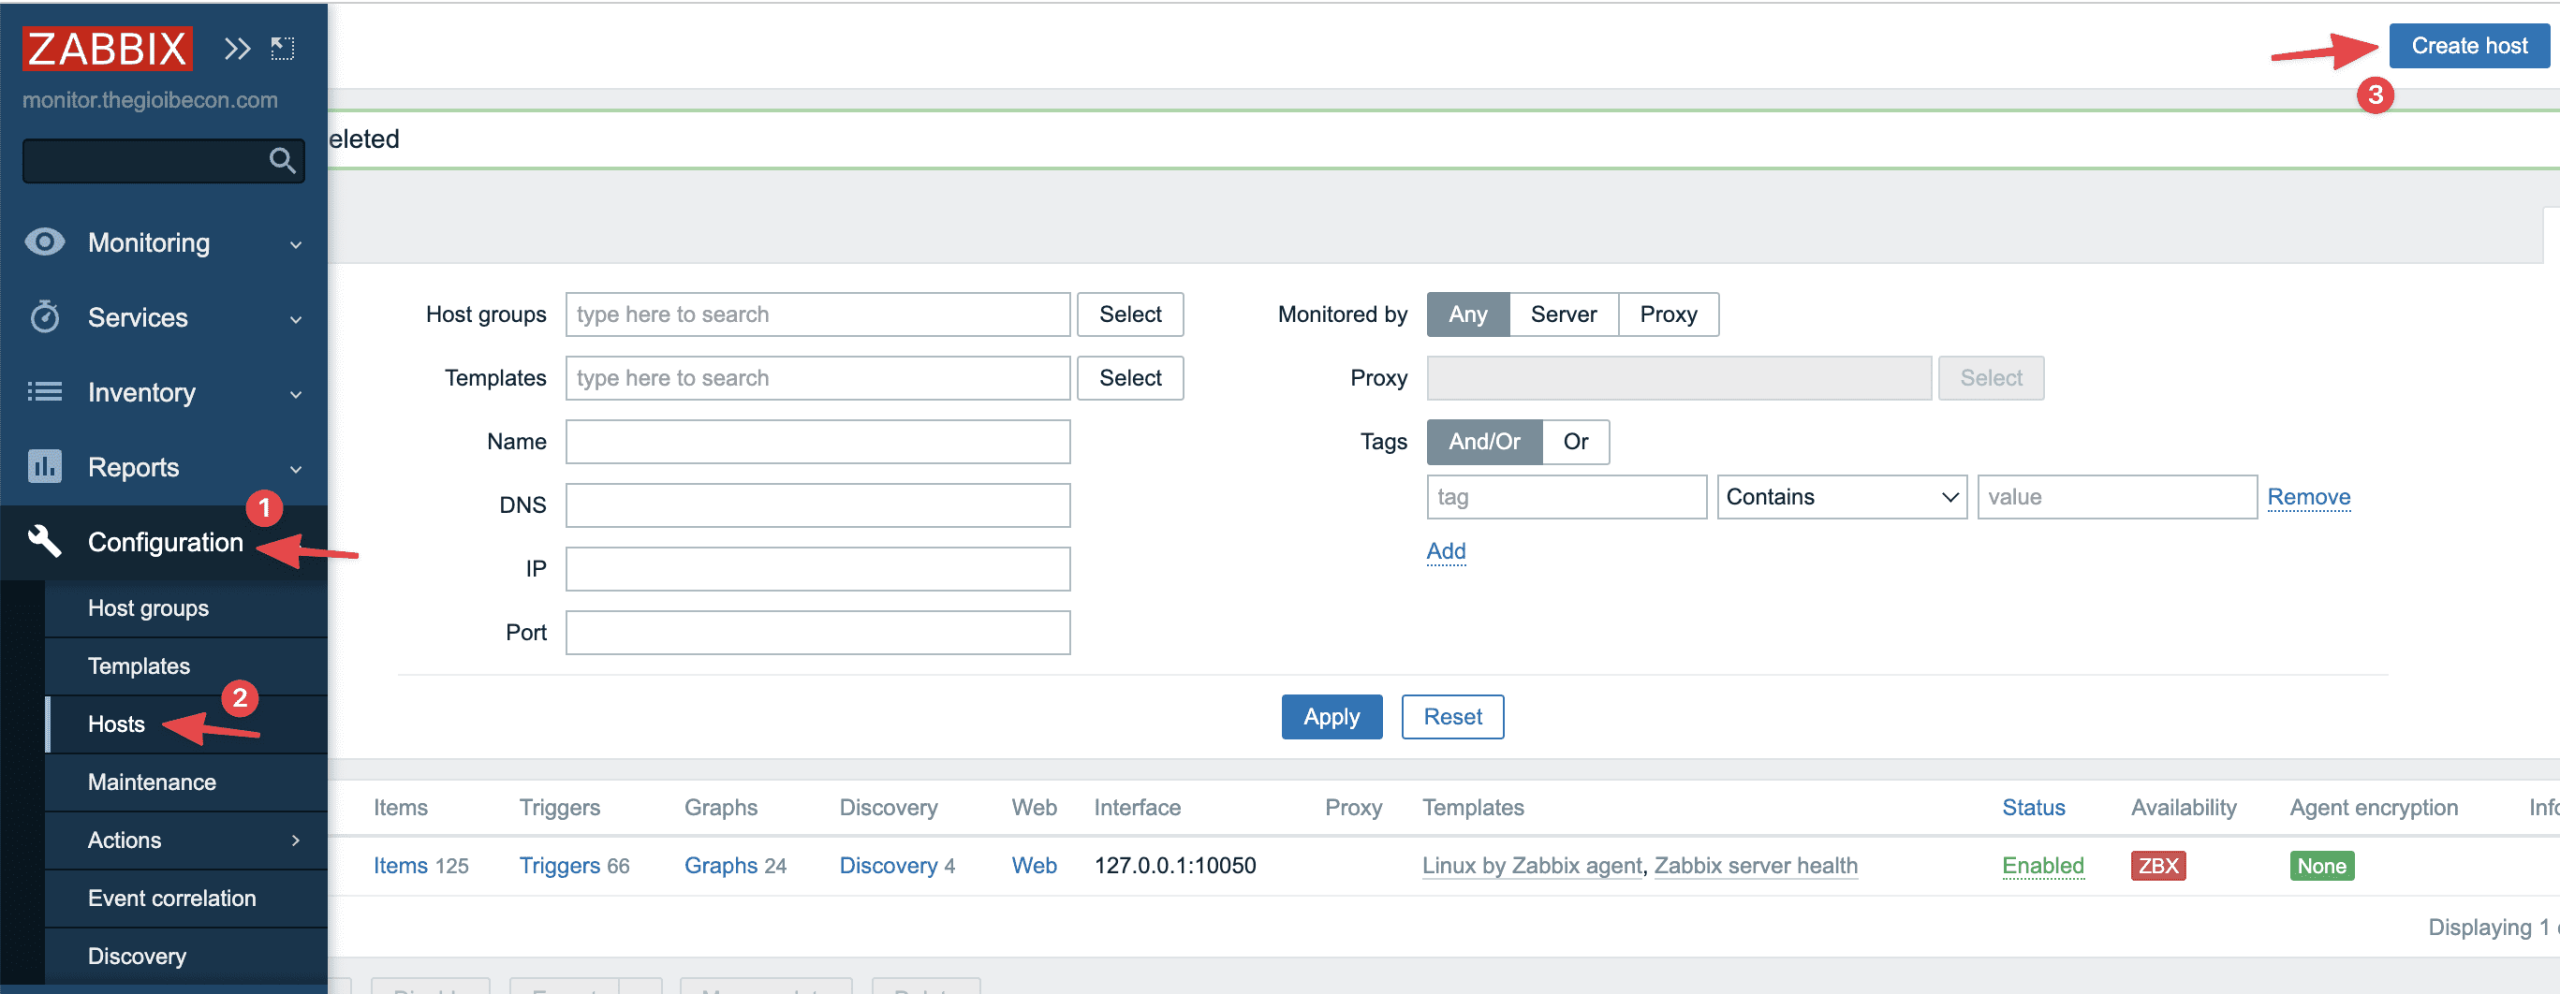
Step 1: Create a Host to set up monitoring
You log in to the Zabbix admin page, then access
Configuration >> Host >> Create Host
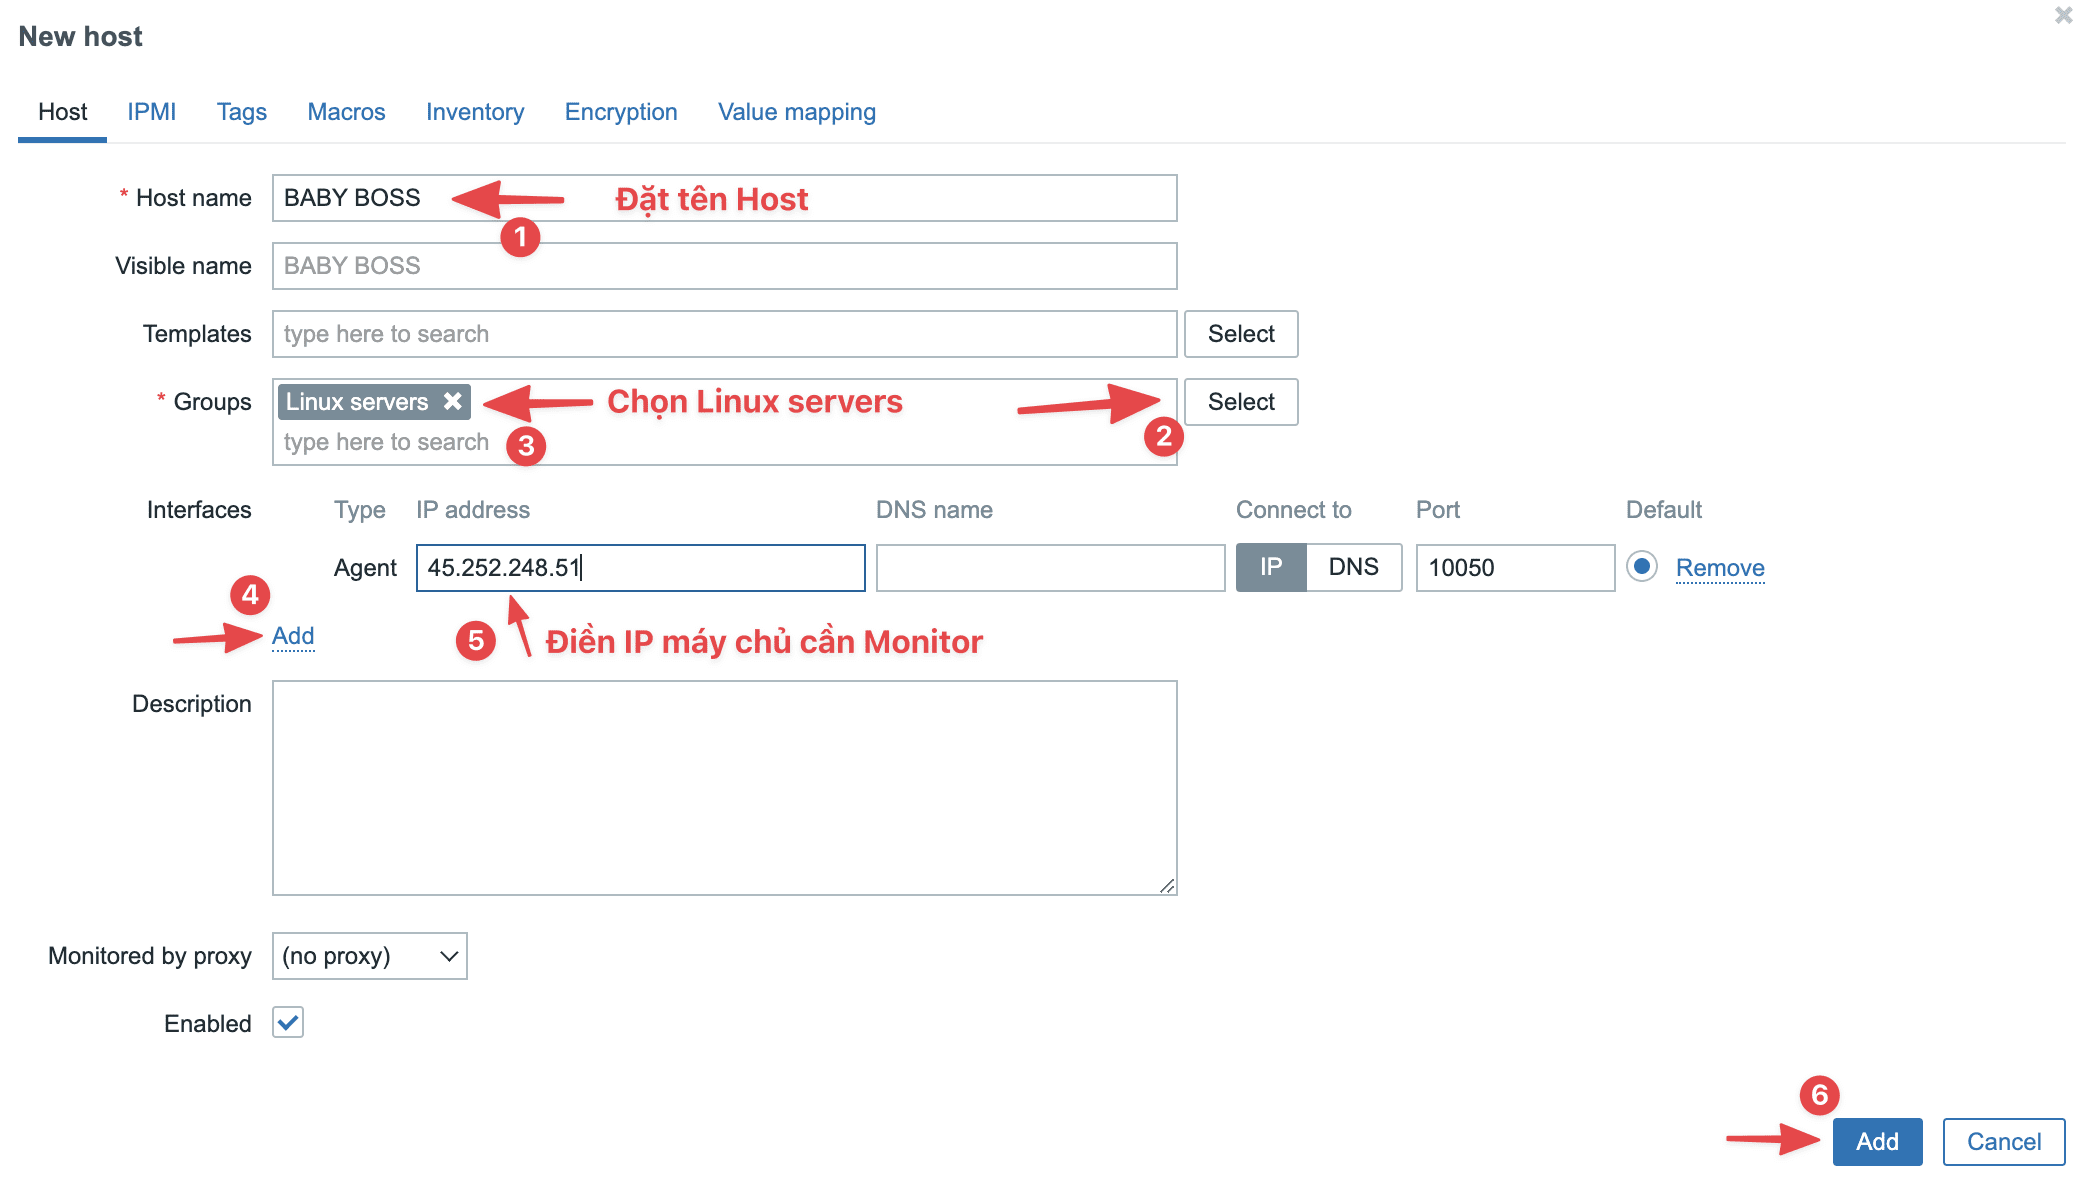
Now you need fill in the necessary information as shown below:
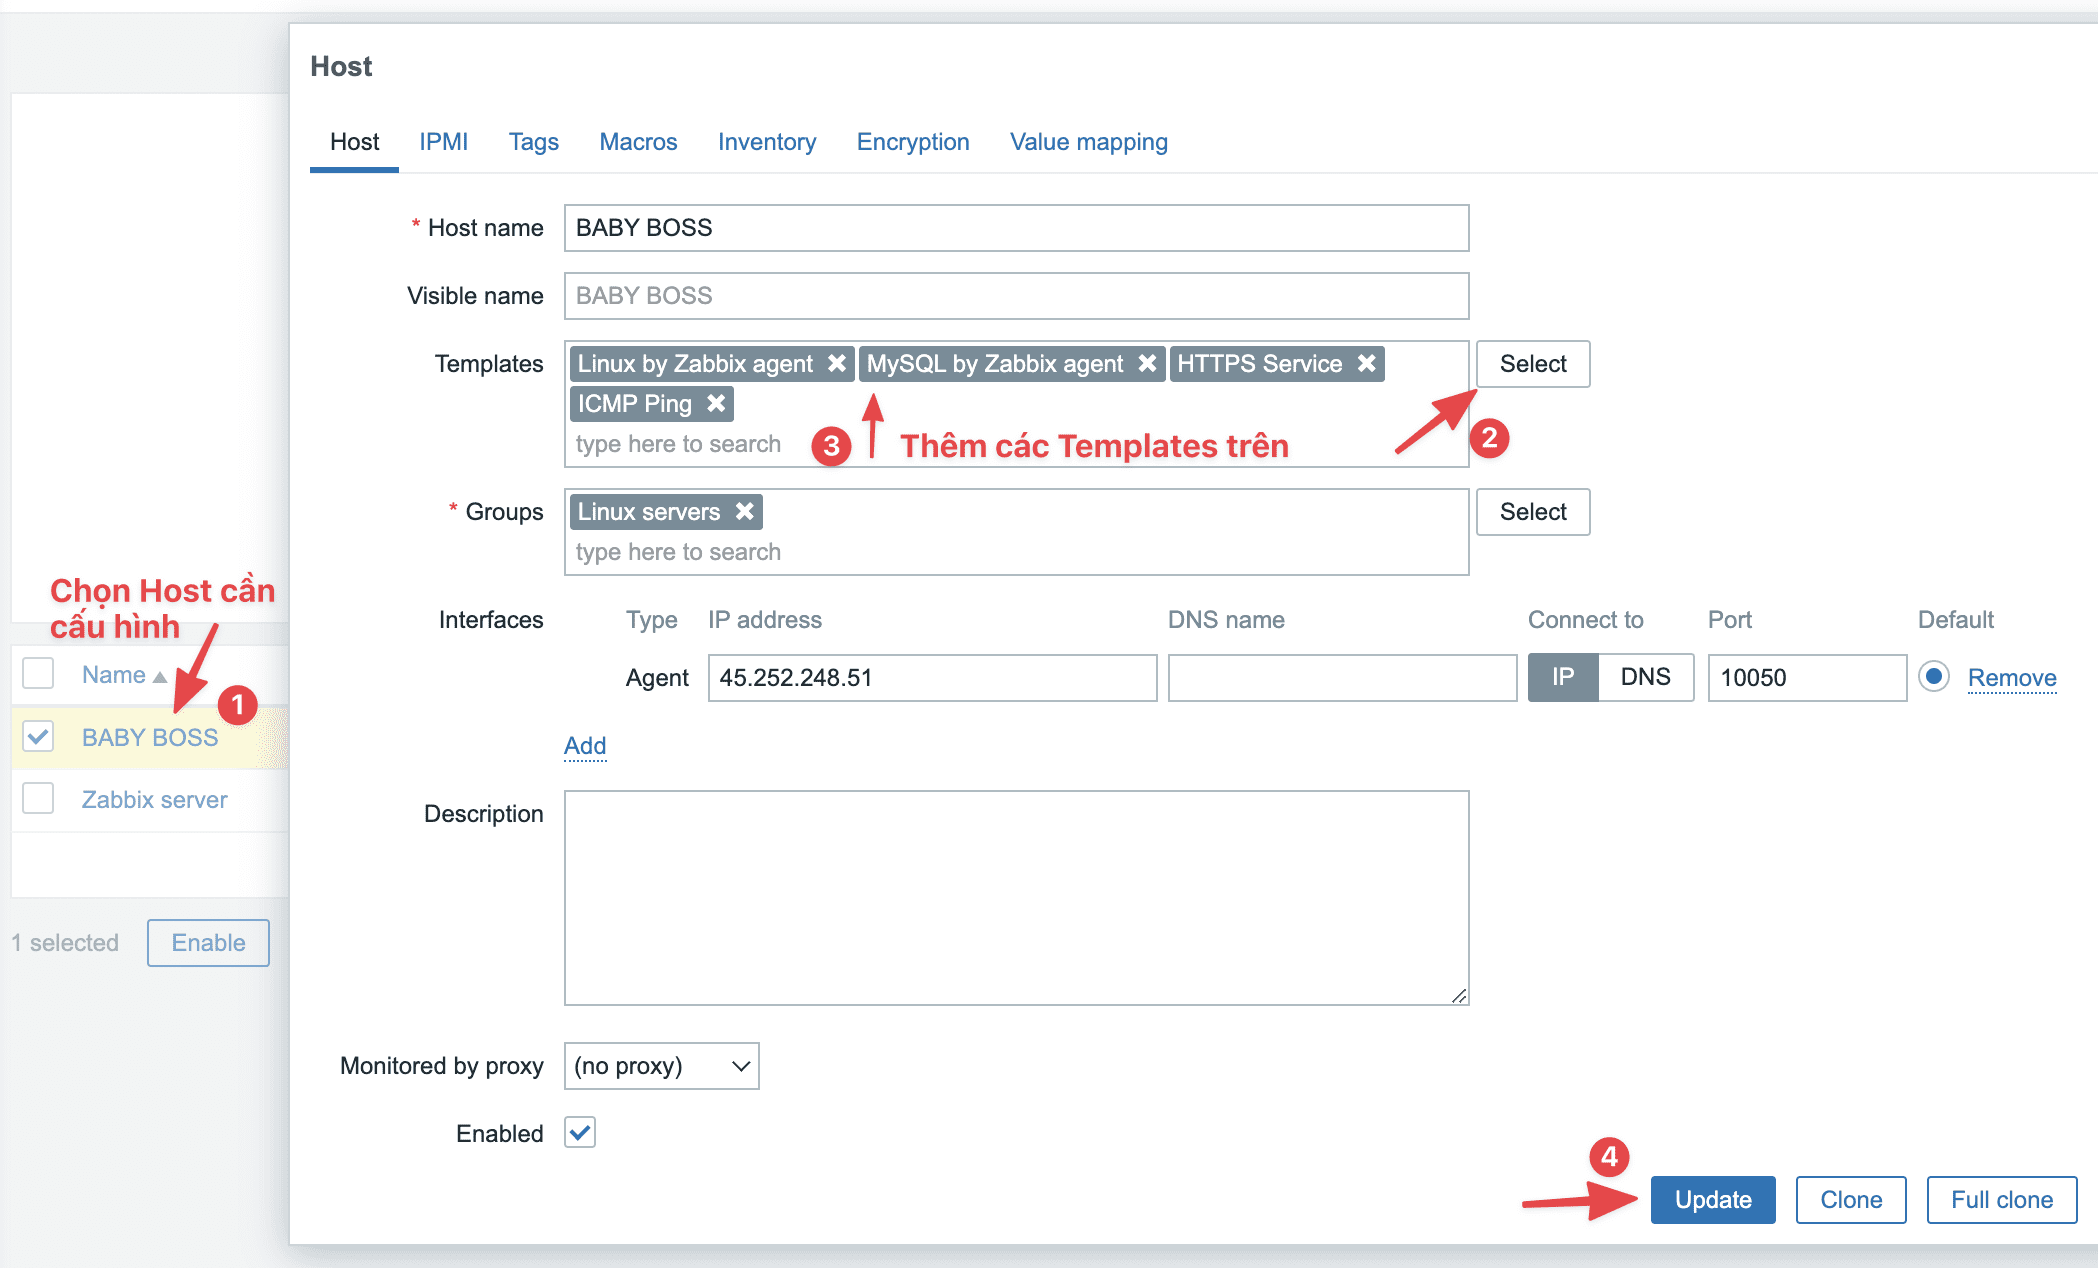
Step 2: Select Templates to monitor the service
Currently, Zabbix has supported many different Templates, but in this article, I will guide you through adding some of the most commonly used and necessary templates for monitoring a web server.
Templates that you should use:
- HTTPS Service
- ICMP Ping
- Linux by Zabbix agent
- MySQL by Zabbix agent
Now you click on the Host you just created, in the Templates section, click Select and add the Templates you need.
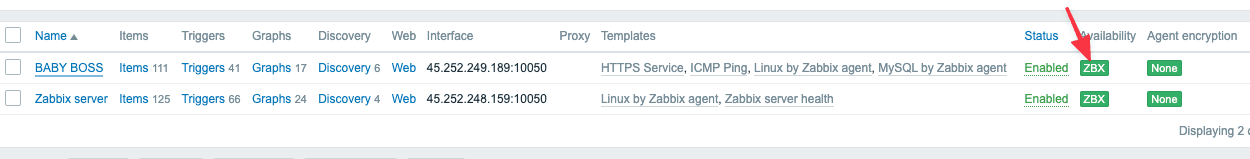
As shown below, you have completed the configuration.
You can refer to other instructions at the link below:
If you need assistance, you can contact support in the ways below:
- Hotline 247: 028 888 24768 (Ext 0)
- Ticket/Email: You use the email to register for the service and send it directly to: support@azdigi.com .
About the author

Thạch Phạm
Đồng sáng lập và Giám đốc điều hành của AZDIGI. Có hơn 15 năm kinh nghiệm trong phổ biến kiến thức liên quan đến WordPress tại thachpham.com, phát triển website và phát triển hệ thống.