

Nội dung
Efficiently monitor network traffic with vnStat and vnStati.
Welcome back to AZDIGI. In today’s article, AZDIGI will guide you through a tool that I frequently use to monitor network traffic, which is vnStat. To proceed, please take a look at this article.
Introduction
VnStat is a network traffic monitoring tool with a command-line interface for Linux and BSD. It keeps track of network traffic records for selected network interfaces, generates logs, and utilizes information provided by the kernel.
Features
- Statistics are available even after the system reboots.
- Monitor multiple network interfaces simultaneously.
- Various output options.
- Sort data by hour, day, month, week, or display the top 10 days.
- Generate output in PNG graphs.
- Lightweight application with minimal system resource consumption.
- Low CPU usage regardless of the amount of traffic generated.
- Can be used by any user, not necessarily root.
- Customizable units (KB, MB, etc.).
- vnStati provides additional options such as:
- -nl / –nolegend
- –Altdate
- –Headertext
- You can generate output in image format.
- Interface bandwidth is automatically detected.
- Supports JSON output.
Installing vnStat on a Linux server
There are several ways to install vnStat, but in this guide, I will show you how to install it from the source using the direct installation command. To start, you need to SSH into your server/VPS. If you don’t know how to SSH, please refer to the following article:
1. Installing vnStat on RHEL/CentOS
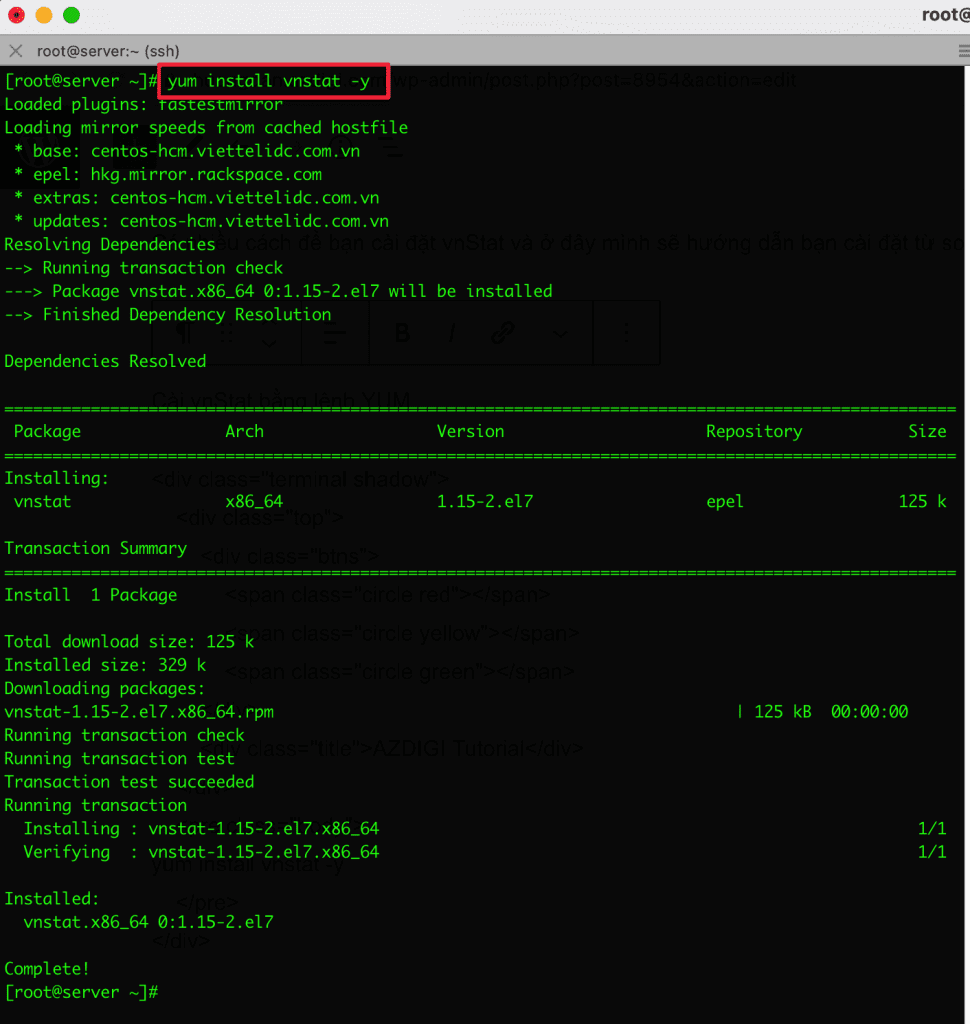
1.1. Installing vnStat using YUM
yum install vnstat -y
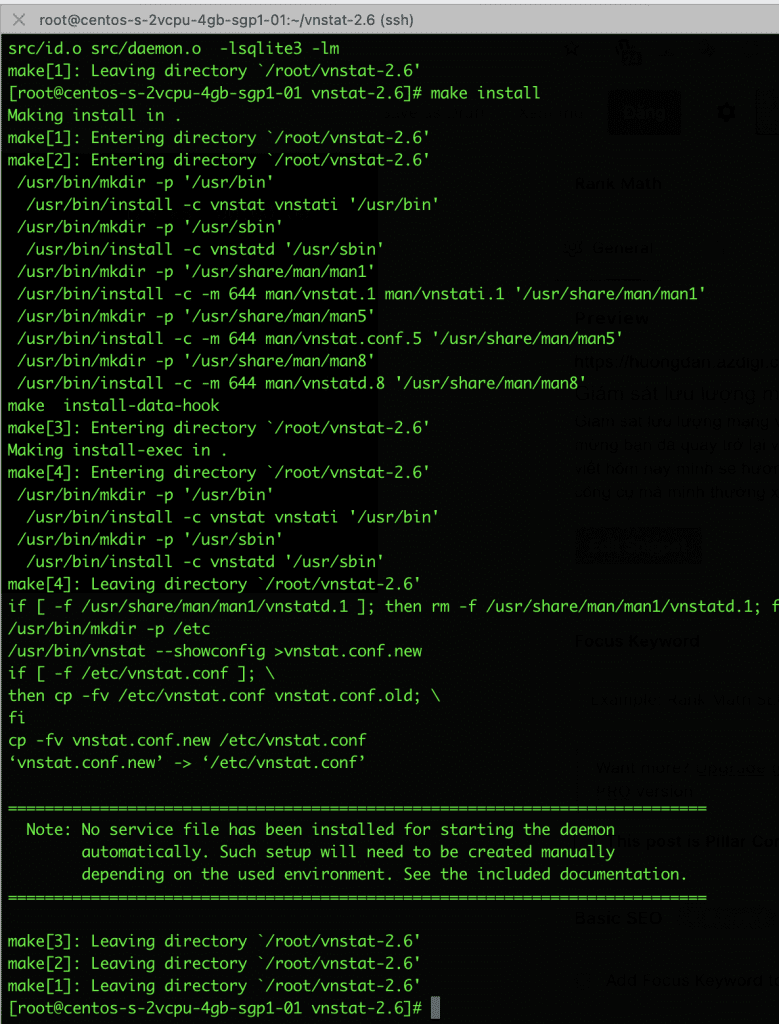
1.2. Installing vnStat from source
To install vnStat from source, follow these commands:
yum group install "Development Tools"
yum install gd gd-devel sqlite-devel
wget https://humdi.net/vnstat/vnstat-2.6.tar.gz
tar -xvf vnstat-2.6.tar.gz
cd vnstat-2.6/
./configure --prefix=/usr --sysconfdir=/etc
make
make install
2. Installing vnStat on Debian/Ubuntu
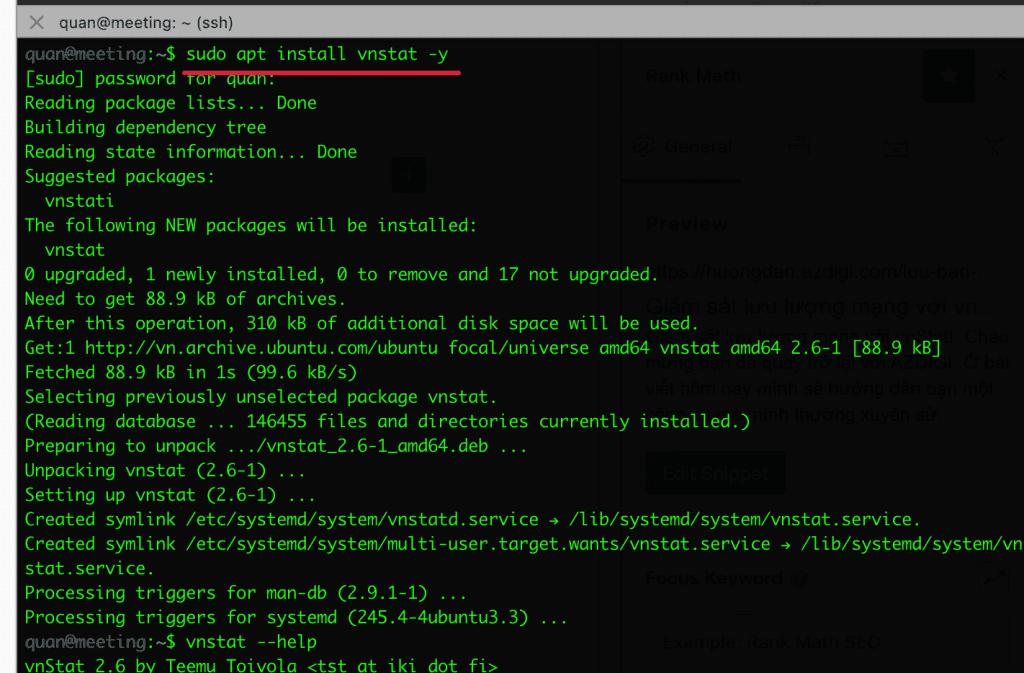
2.1. Installing vnStat using apt
sudo apt install vnstat -y
2.2. Installing vnStat from source
sudo apt-get install build-essential gd gd-devel libsqlite3-dev
wget https://humdi.net/vnstat/vnstat-2.6.tar.gz
tar -xvf vnstat-2.6.tar.gz
cd vnstat-2.6/
sudo ./configure --prefix=/usr --sysconfdir=/etc
sudo make
sudo make install
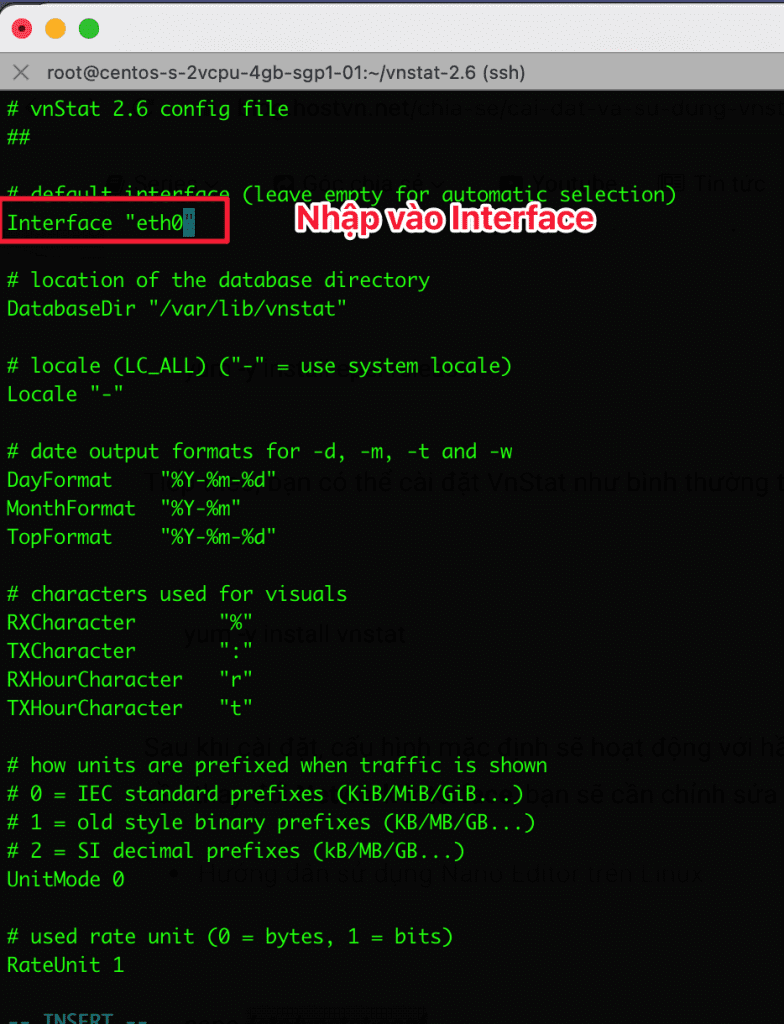
3. Configuring vnStat
By default, after installing vnStat, it will run on the network interface with eth0 as the interface. If your device is not using “eth0“, you need to change the network interface in the configuration file.
vi /etc/vnstat.conf
- Next, you need to create the database and specify the storage location.
vnstat -i eth0
chown vnstat:vnstat /var/lib/vnstat/eth0
- Then, restart vnstat to start using it.
systemctl start vnstat
systemctl enable vnstat
Using vnStat Guide
Before you start using vnStat, familiarize yourself with the syntax and options available.
Syntax of execution
vnstat
vnstat -i {interface}
vnstat -i {interface} -option
vnstat -i {interface} -option1 -option2
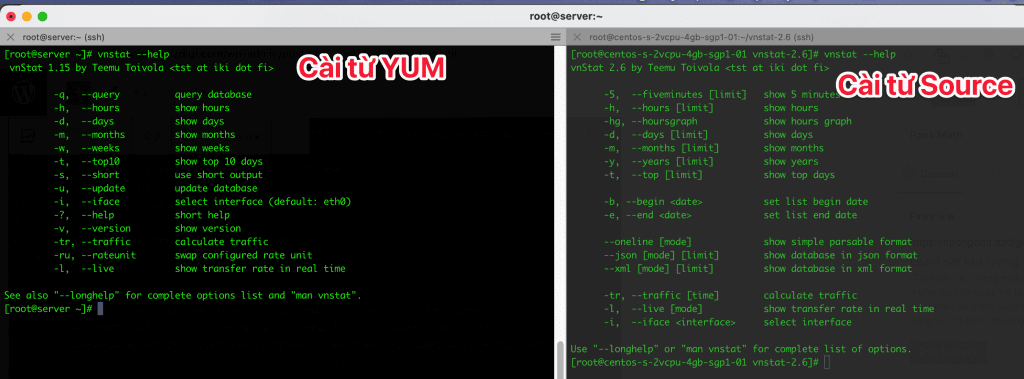
Explanation of options:
- -q, –query: Query the database
- -h, –hours: Display hours
- -d, –days: Display days
- -m, –months: Display months
- -w, –weeks: Display weeks
- -t, –top10: Display top 10 days
- -s, –short: Display short output
- -u, –update: Update the database
- -i, –iface: Specify interface (default is eth0)
- -?, –help: Display help
- -v, –version: Display version
- -tr, –traffic: Calculate traffic
- -ru, –rateunit: Swap configured rate unit
- -l, –live: Display real-time transfer rate
For example
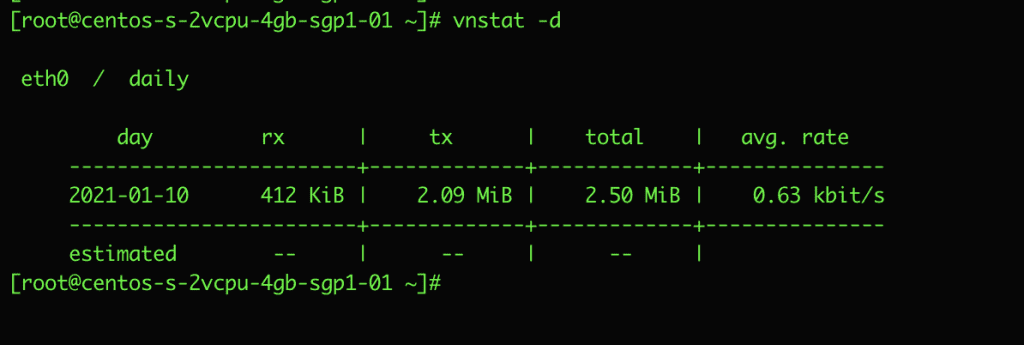
- Display daily statistics
vnstat -d
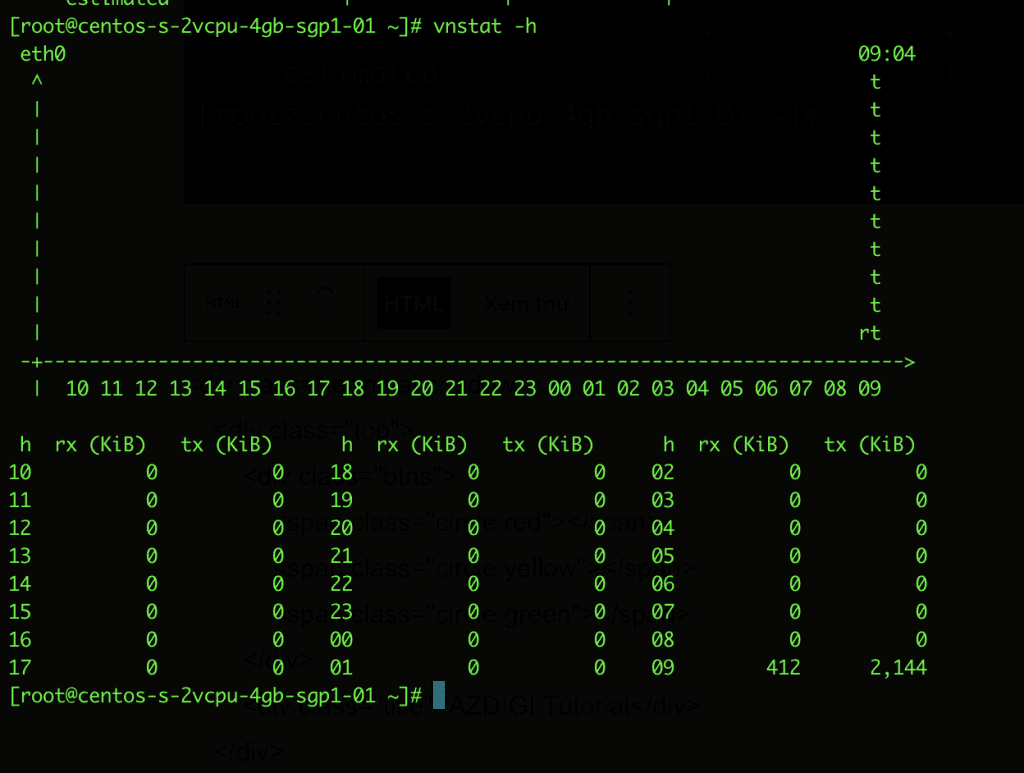
- Display hourly statistics
vnstat -h
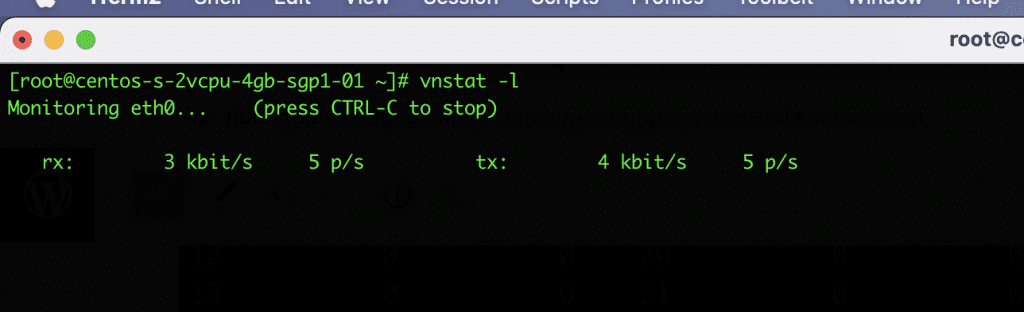
- Display real-time statistics
vnstat -l
Using vnStati Guide
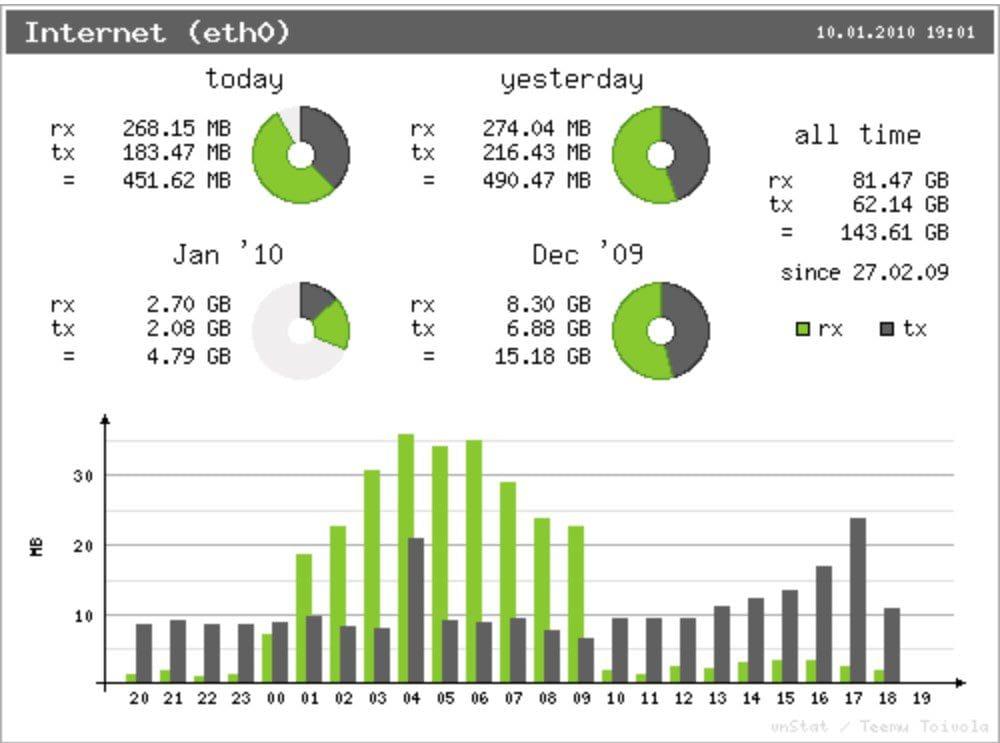
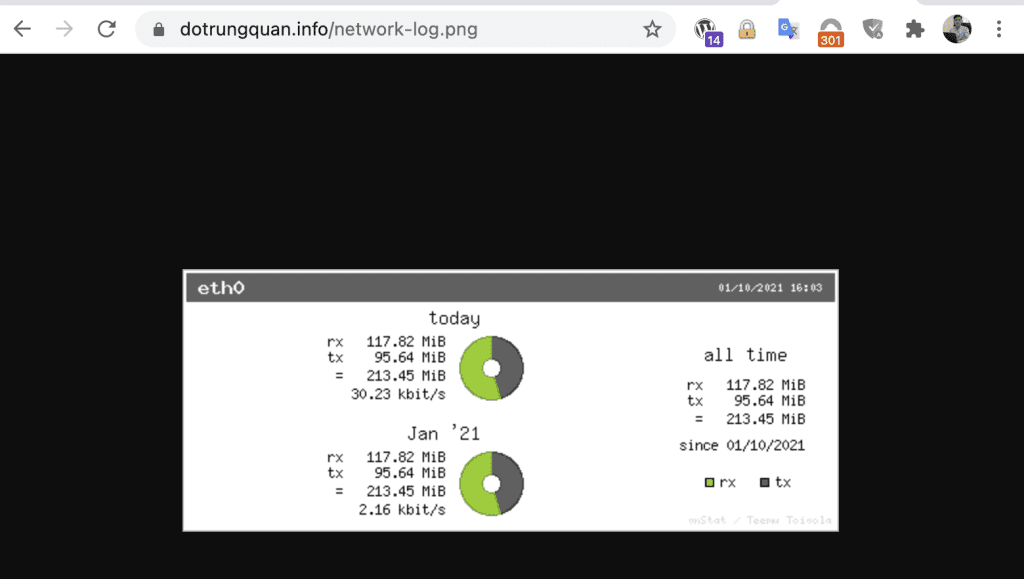
To visualize the statistical data more conveniently, you can use the vnStati tool to generate .png images for vnStat.
vnStati is automatically installed along with vnStat, so there is no need for any additional installation steps. To create an image, follow these instructions:
vnstati -s -i eth0 -o /home/quandt/domains/dotrungquan.info/public_html/network-log.png
In there:
- vnstati: the command to execute
- -s: summary
- -i: interface
- /home/quandt/domains/dotrungquan.info/public_html/network-log.png: path and file
Illustrative example image:
To use and learn more about vnStati, you can use the command vnStati --help to display the available options.
[root@centos-s-2vcpu-4gb-sgp1-01 ~]# vnstati --help vnStat image output 1.15 by Teemu Toivola-h, --hours output hours -d, --days output days -m, --months output months -t, --top10 output top10 -s, --summary output summary -hs, --hsummary output horizontal summary with hours -vs, --vsummary output vertical summary with hours -nh, --noheader remove header from output -ne, --noedge remove edge from output -nl, --nolegend remove legend from output -ru, --rateunit swap configured rate unit -o, --output select output filename -c, --cache update output only when too old -i, --iface used interface (default: eth0) -?, --help this help -D, --debug show some additional debug information -v, --version show version --dbdir select database directory --style select output style (0-3) --locale set locale --config select config file --altdate use alternative date location --headertext specify header text string --transparent toggle background transparency See also "man vnstati".
Summary
Through this tutorial, we hope this article has helped you successfully install and effectively manage network traffic on your server devices.
If you need assistance, you can contact support in the ways below:
- Hotline 247: 028 888 24768 (Ext 0)
- Ticket/Email: You use the email to register for the service and send it directly to: support@azdigi.com .
